
Loki Metrics Dashboard
Loki Metrics Dashboard
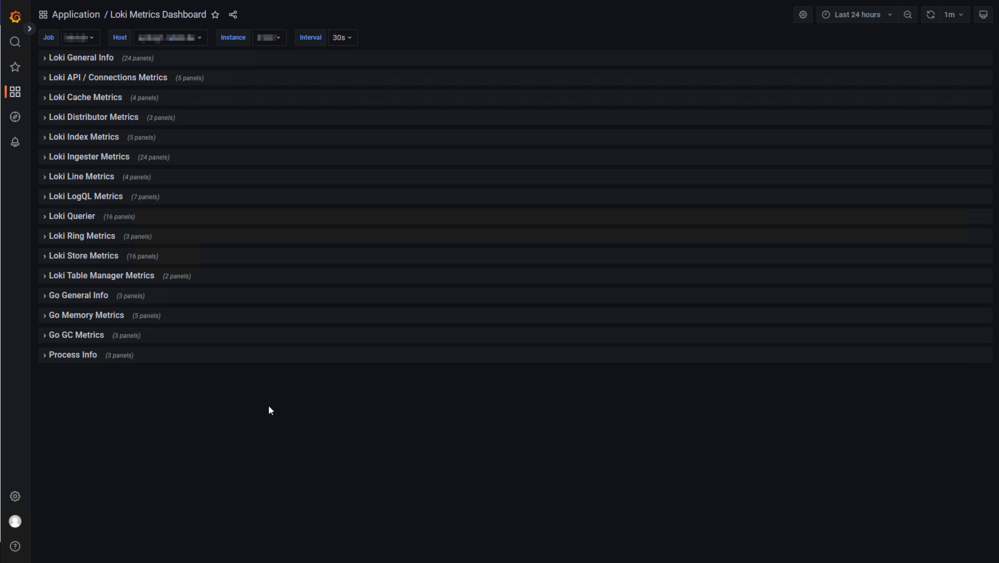
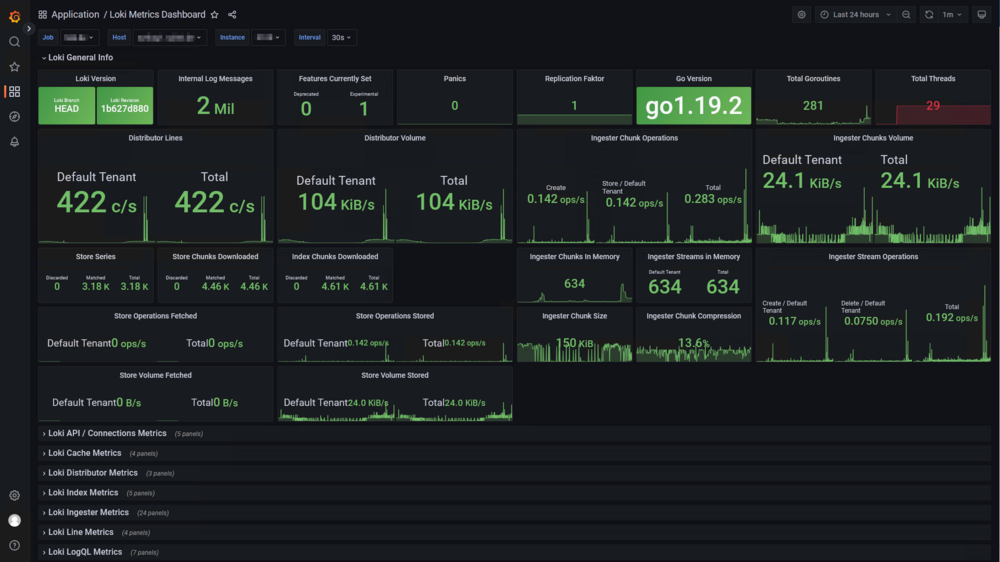
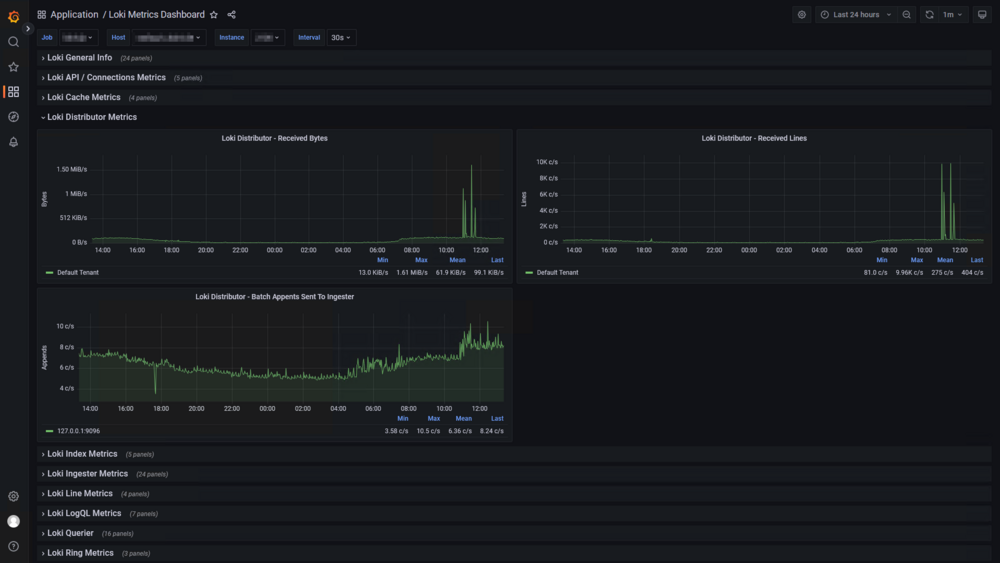
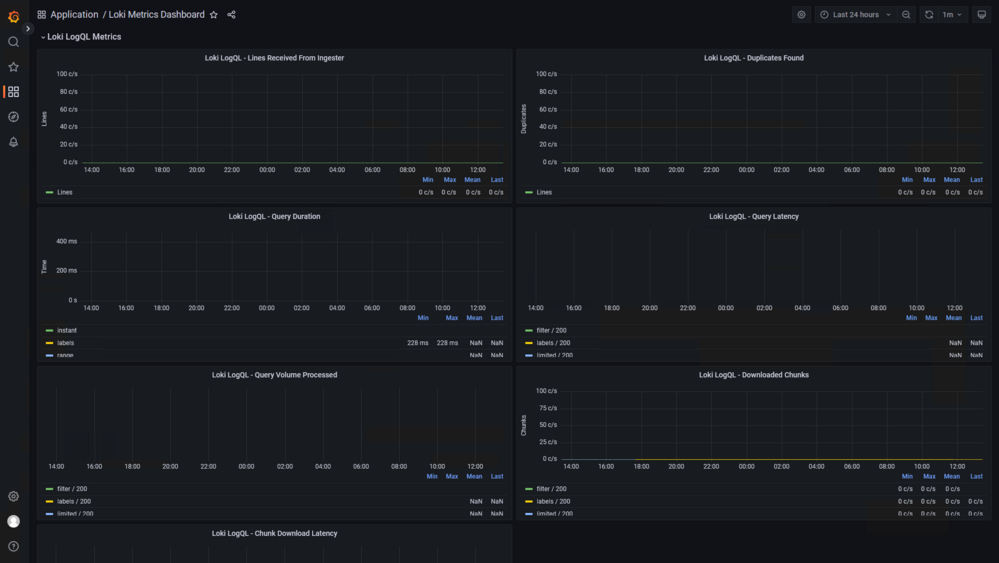
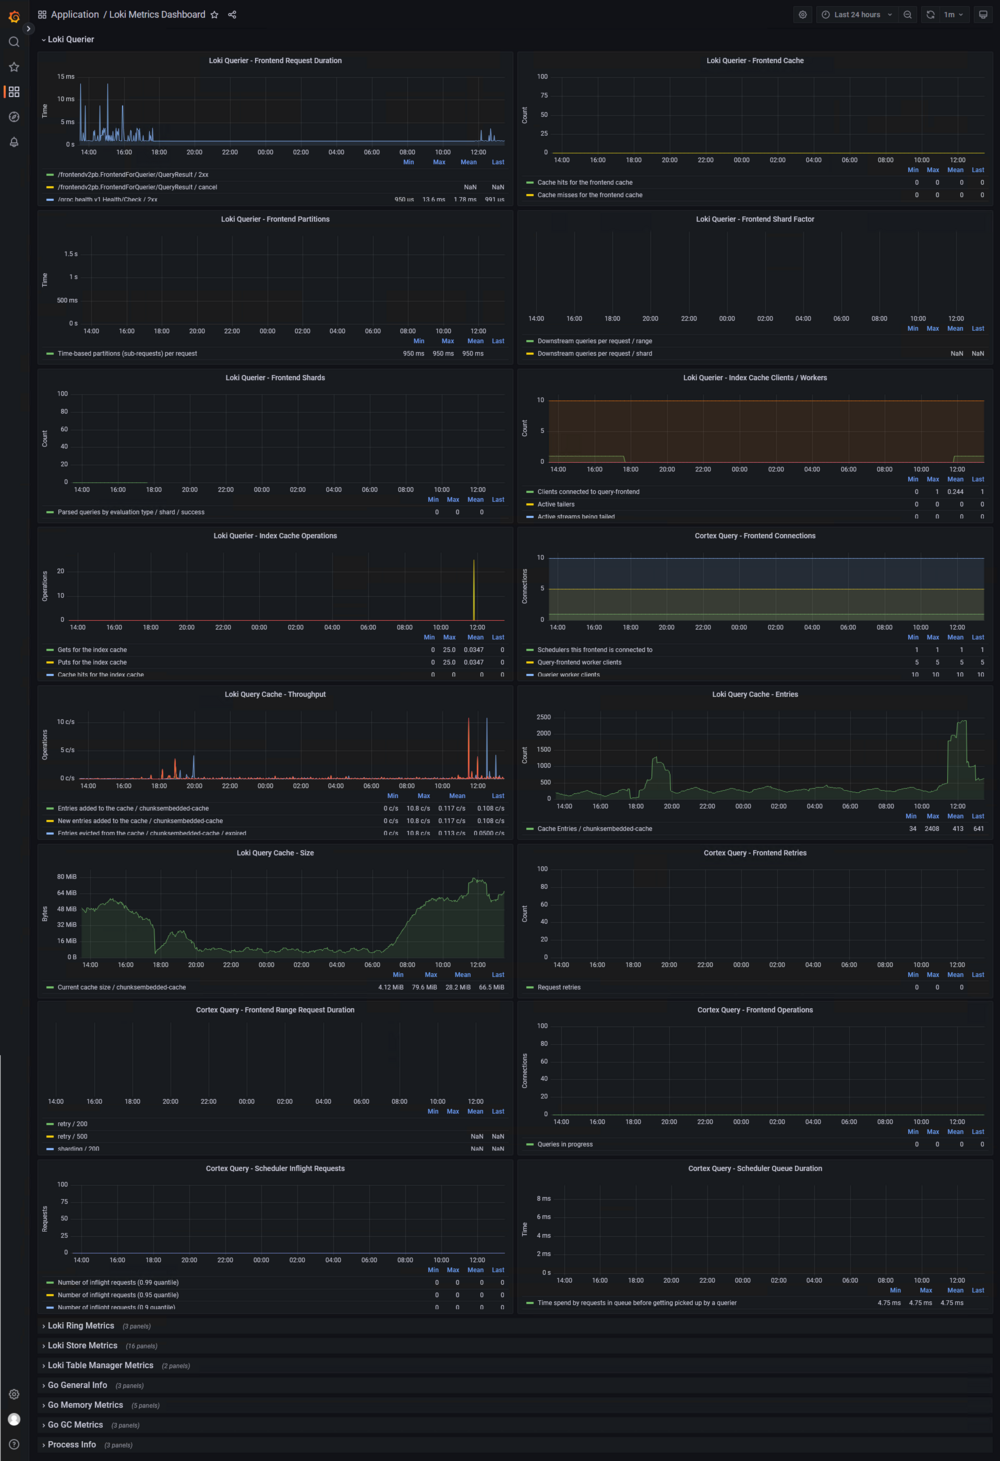
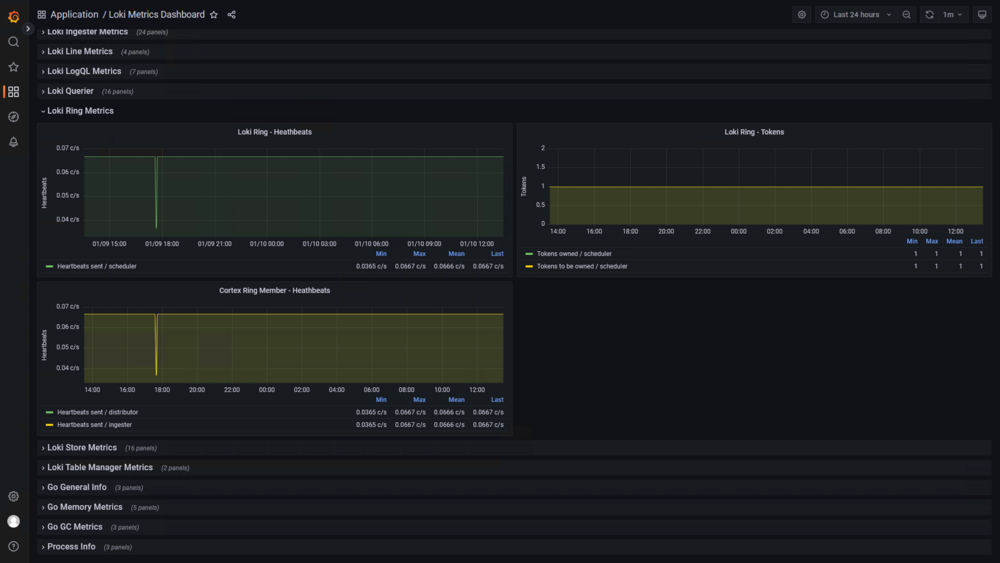
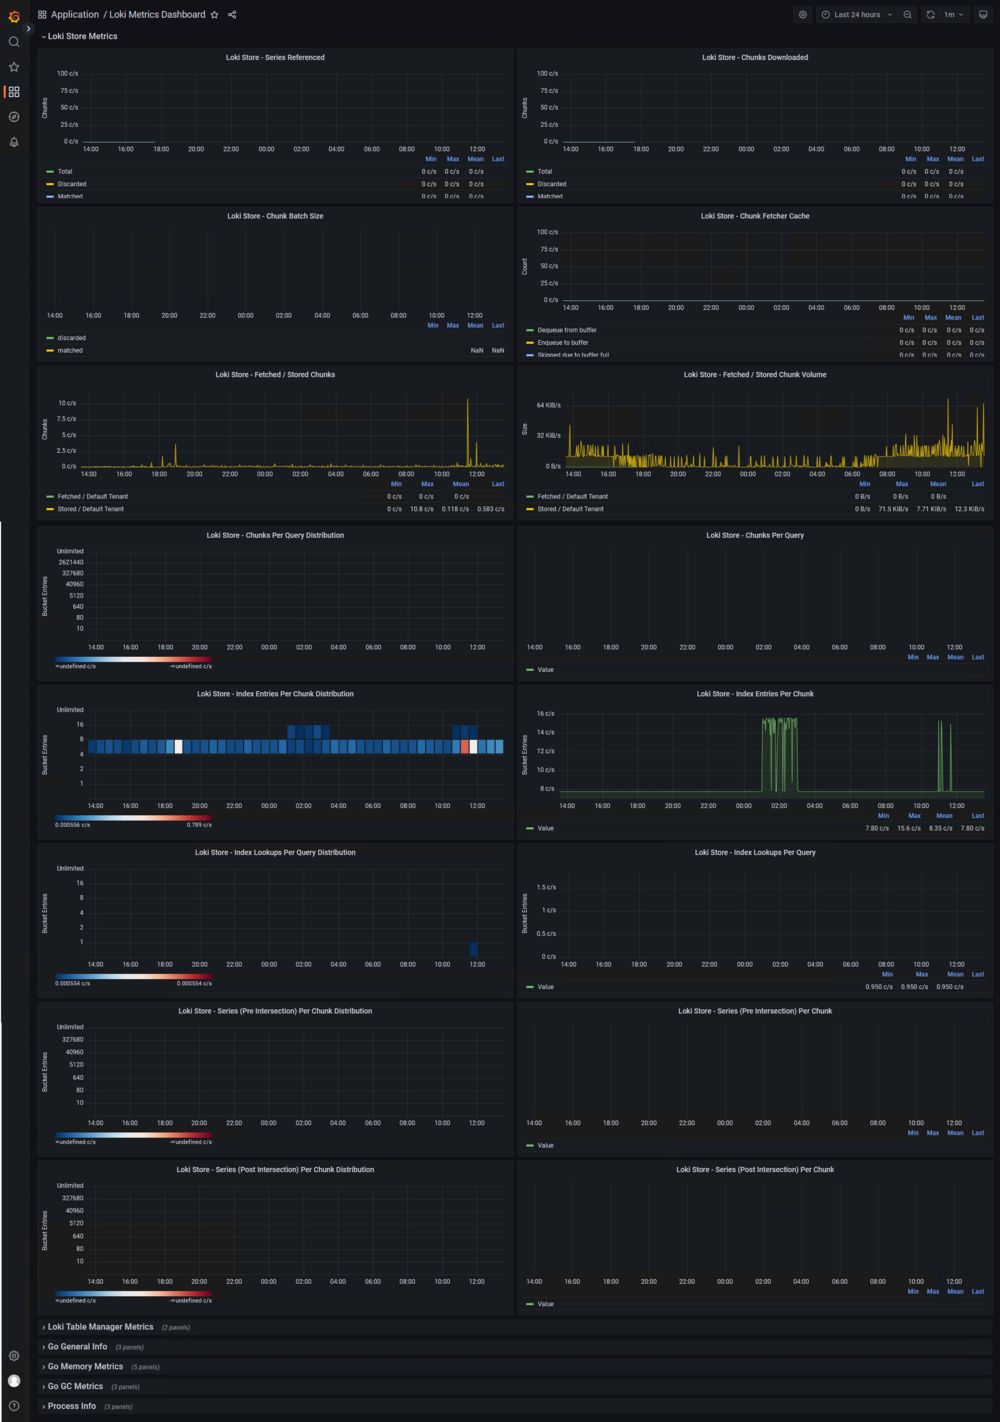
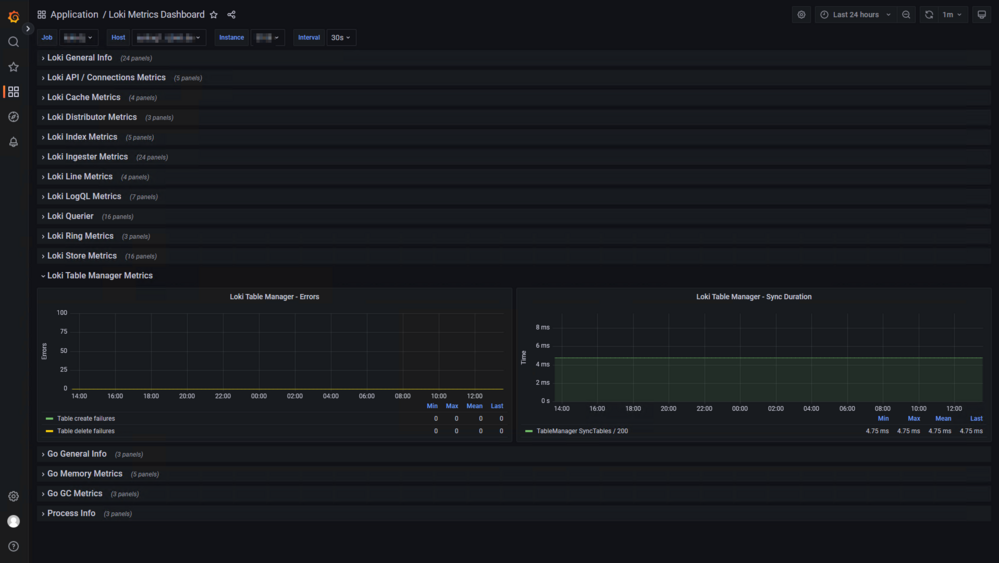
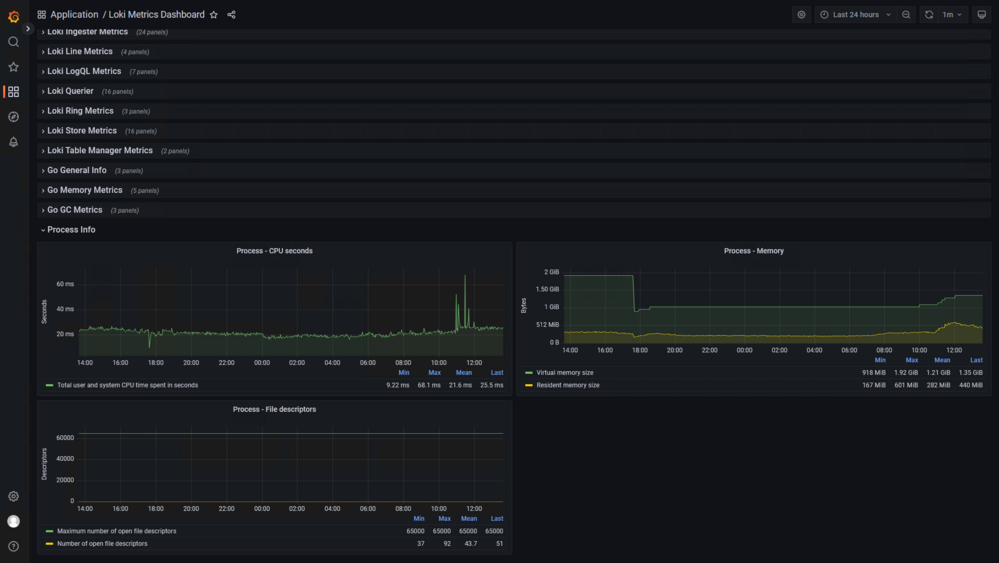
A metrics dashboard for the metrics provided by Grafana Loki.
Metrics are expected to be collected by Prometheus from Loki. Supports multiple Prometheus jobs for querying metrics from multiple Grafana Loki instances.
Where applicable the graphs are able to work with the tenant feature in Grafana Loki.
Initially created with Grafana v9.3.1 and Grafana Loki v2.7.0
Data source config
Collector type:
Collector plugins:
Collector config:
Revisions
Upload an updated version of an exported dashboard.json file from Grafana
| Revision | Description | Created | |
|---|---|---|---|
| Download |
Grafana Loki (self-hosted)
Easily monitor Grafana Loki (self-hosted), a horizontally scalable, highly available, multi-tenant log aggregation system inspired by Prometheus, with Grafana Cloud's out-of-the-box monitoring solution.
Learn more