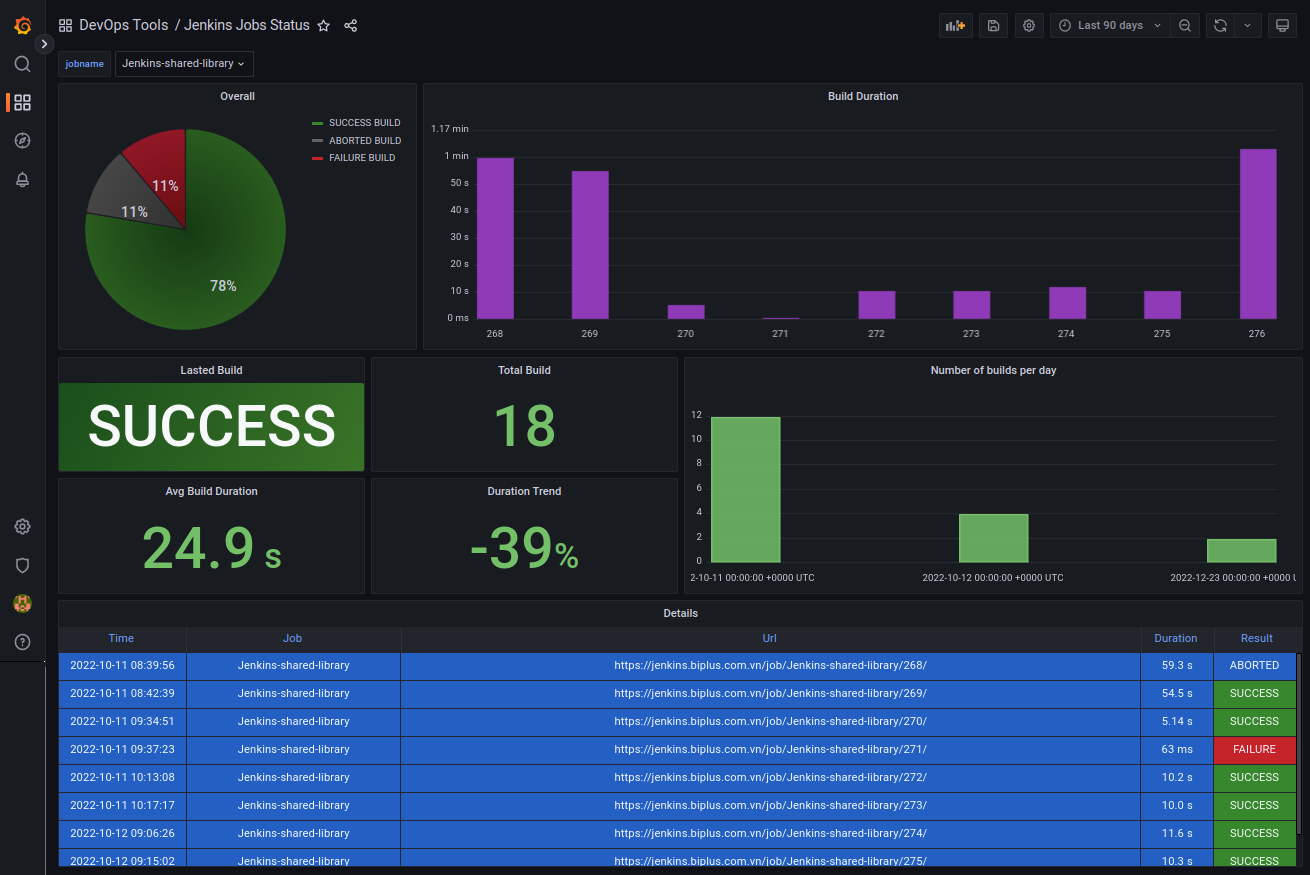
Jenkins Job Status
The `Jenkins Job Status` dashboard presents job n build data from Jenkins
Quick start with docker
Run command below (edit env):
docker run -d \
-eJENKINS_URL='http://192.168.3.100:8080' \
-eJENKINS_USER='admin' \
-eJENKINS_PASSWORD='MqU9Czz8T...' \
-eINFLUX_TOKEN="KlXfBqa0uSGs0icfE-3g8FsQAoC9..." \
-eINFLUX_DB="http://192.168.3.101:8086" \
-eINFLUX_ORG="org" \
-eBUCKET_NAME="jenkins_test" \
return200/jenkins-collector:0.1.0
Cronjob is set " 0 0 * * * " current.
cat crontab
# START CRON JOB
0 0 * * * /usr/local/bin/python3 /jenkins_collector/main.py > /proc/1/fd/1 2>/proc/1/fd/2
# END CRON JOB
Run collector by manual
/usr/local/bin/python3 /jenkins_collector/main.py
Check data in influx
Config datasource
Import dashboard in grafana
Data source config
Collector config:
Upload an updated version of an exported dashboard.json file from Grafana
| Revision | Description | Created | |
|---|---|---|---|
| Download |
Jenkins
Easily monitor your deployment of Jenkins, the open source automation server, with Grafana Cloud's out-of-the-box monitoring solution.
Learn more
