Django
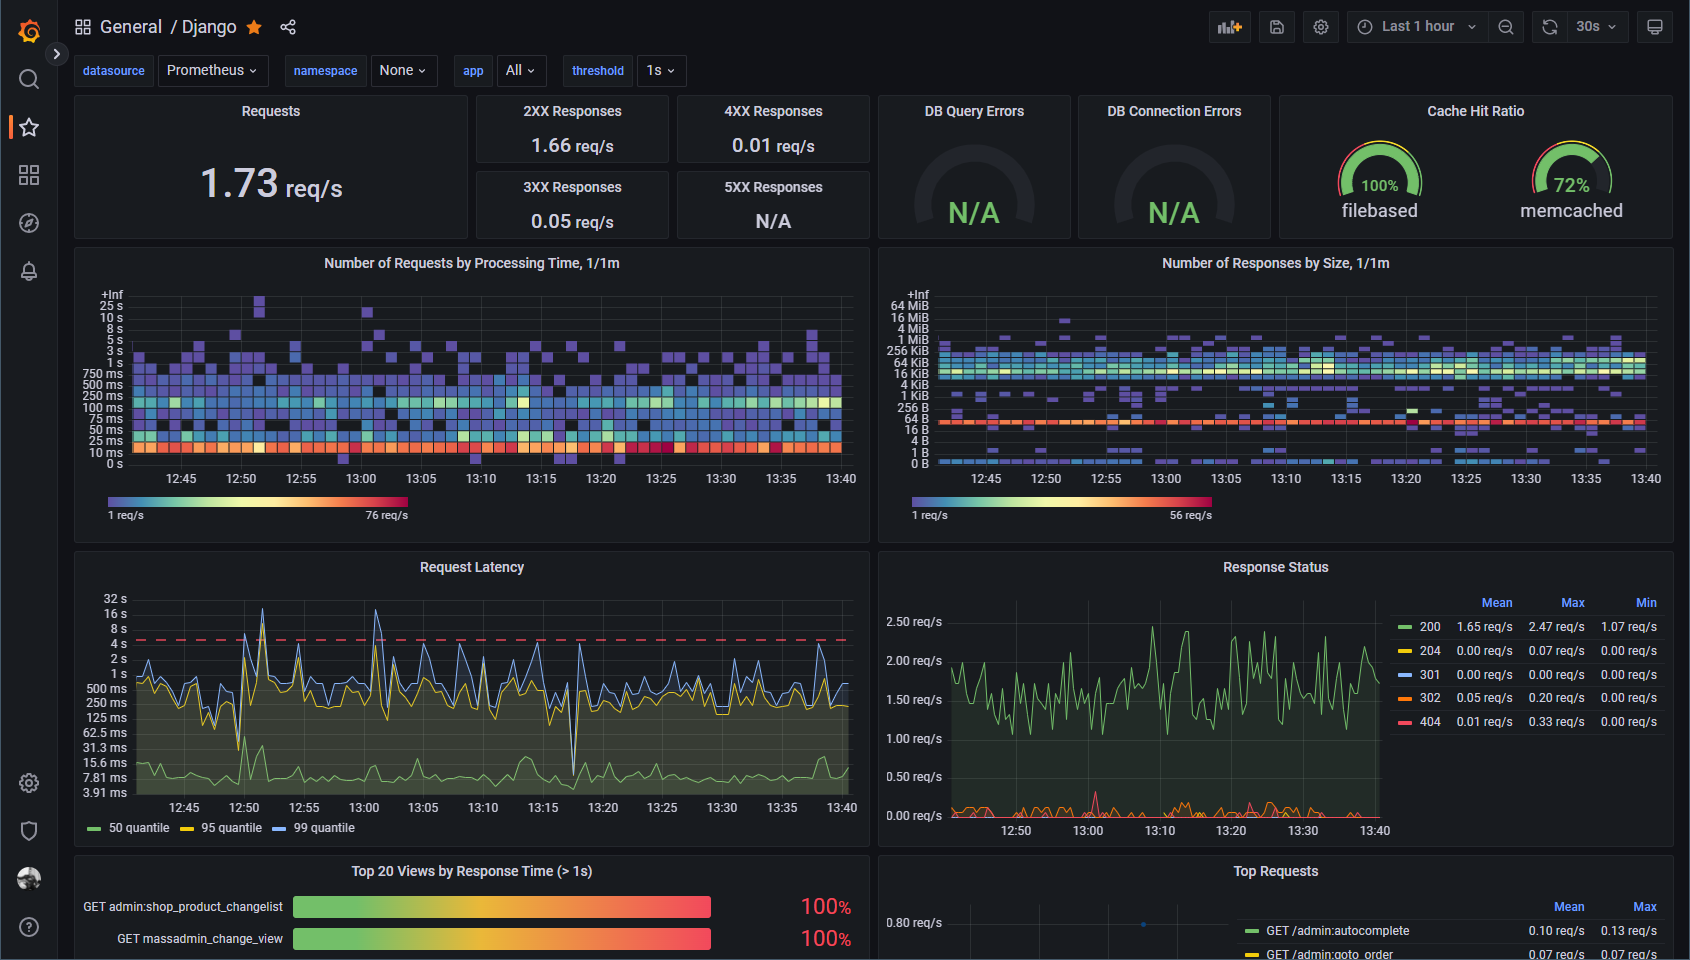
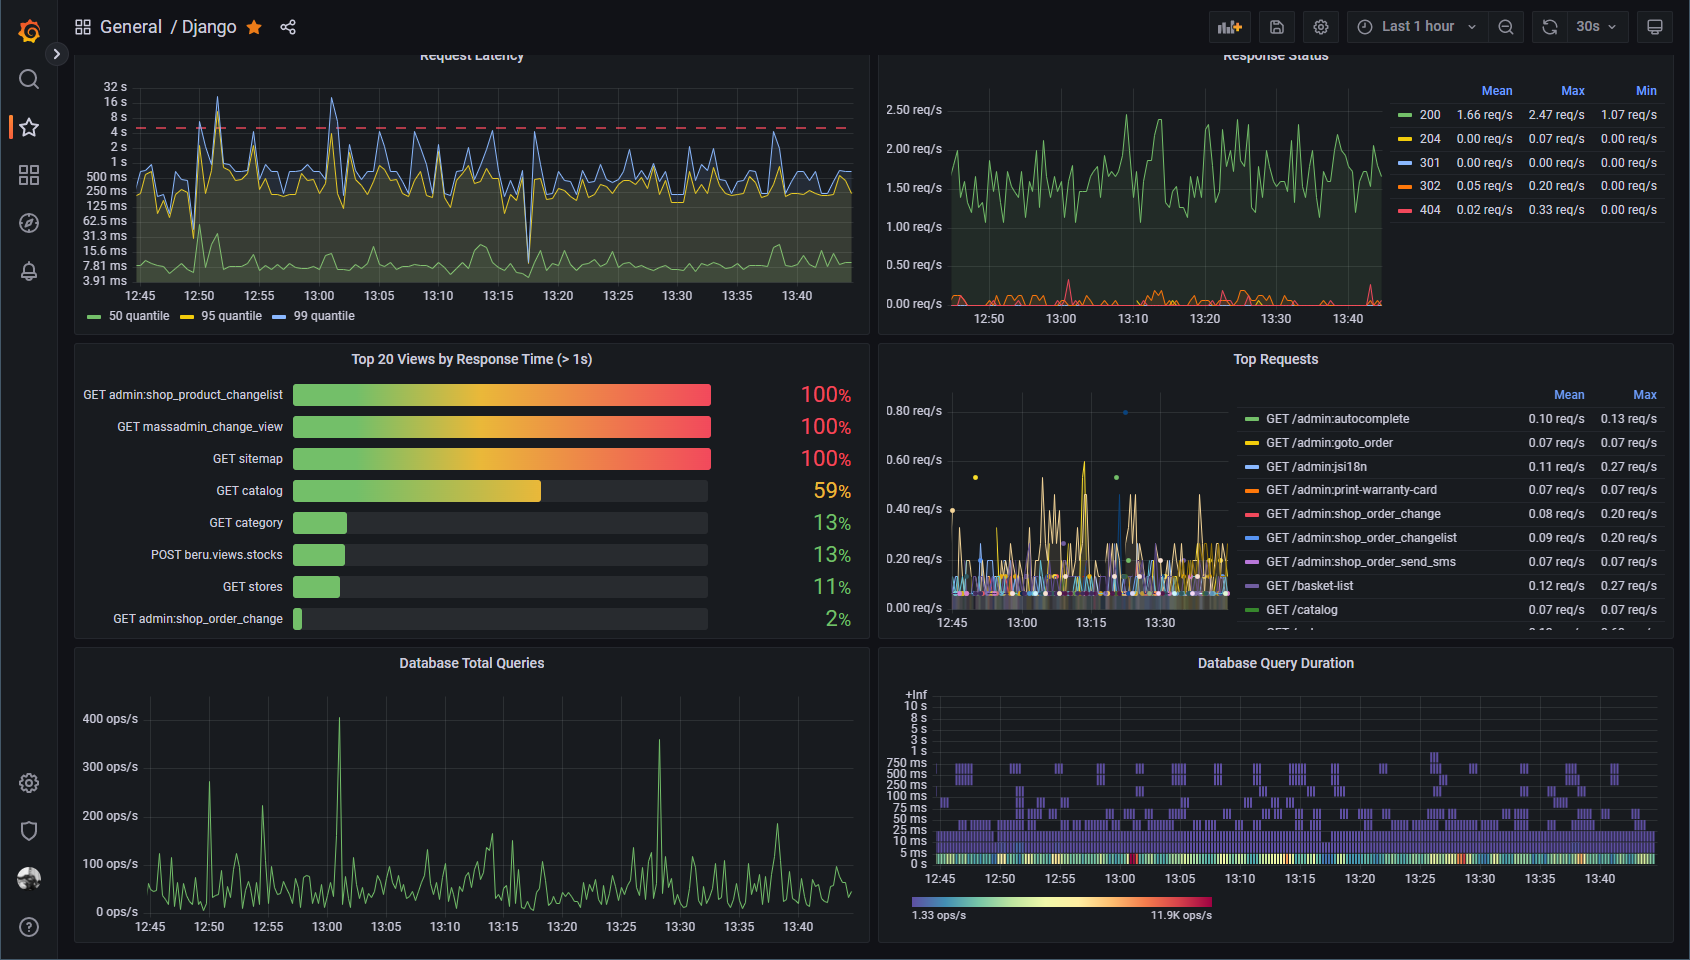
Django metrics dashboard using django-prometheus metrics exporter
Django metrics dashboard showing request latency, top long executing views, database and cache status. Uses django-prometheus metrics exporter.
Application label is injected in Prometheus configuration to distinguish virtual hosts:
- job name: django
  static_configs:
    - targets: ['localhost:9110']
      labels:
        app: 'somesite'
Data source config
Collector config:
Upload an updated version of an exported dashboard.json file from Grafana
| Revision | Description | Created | |
|---|---|---|---|
| Download |


