
Podman Dashboard EN
Podman dashboard by DreamOfIce
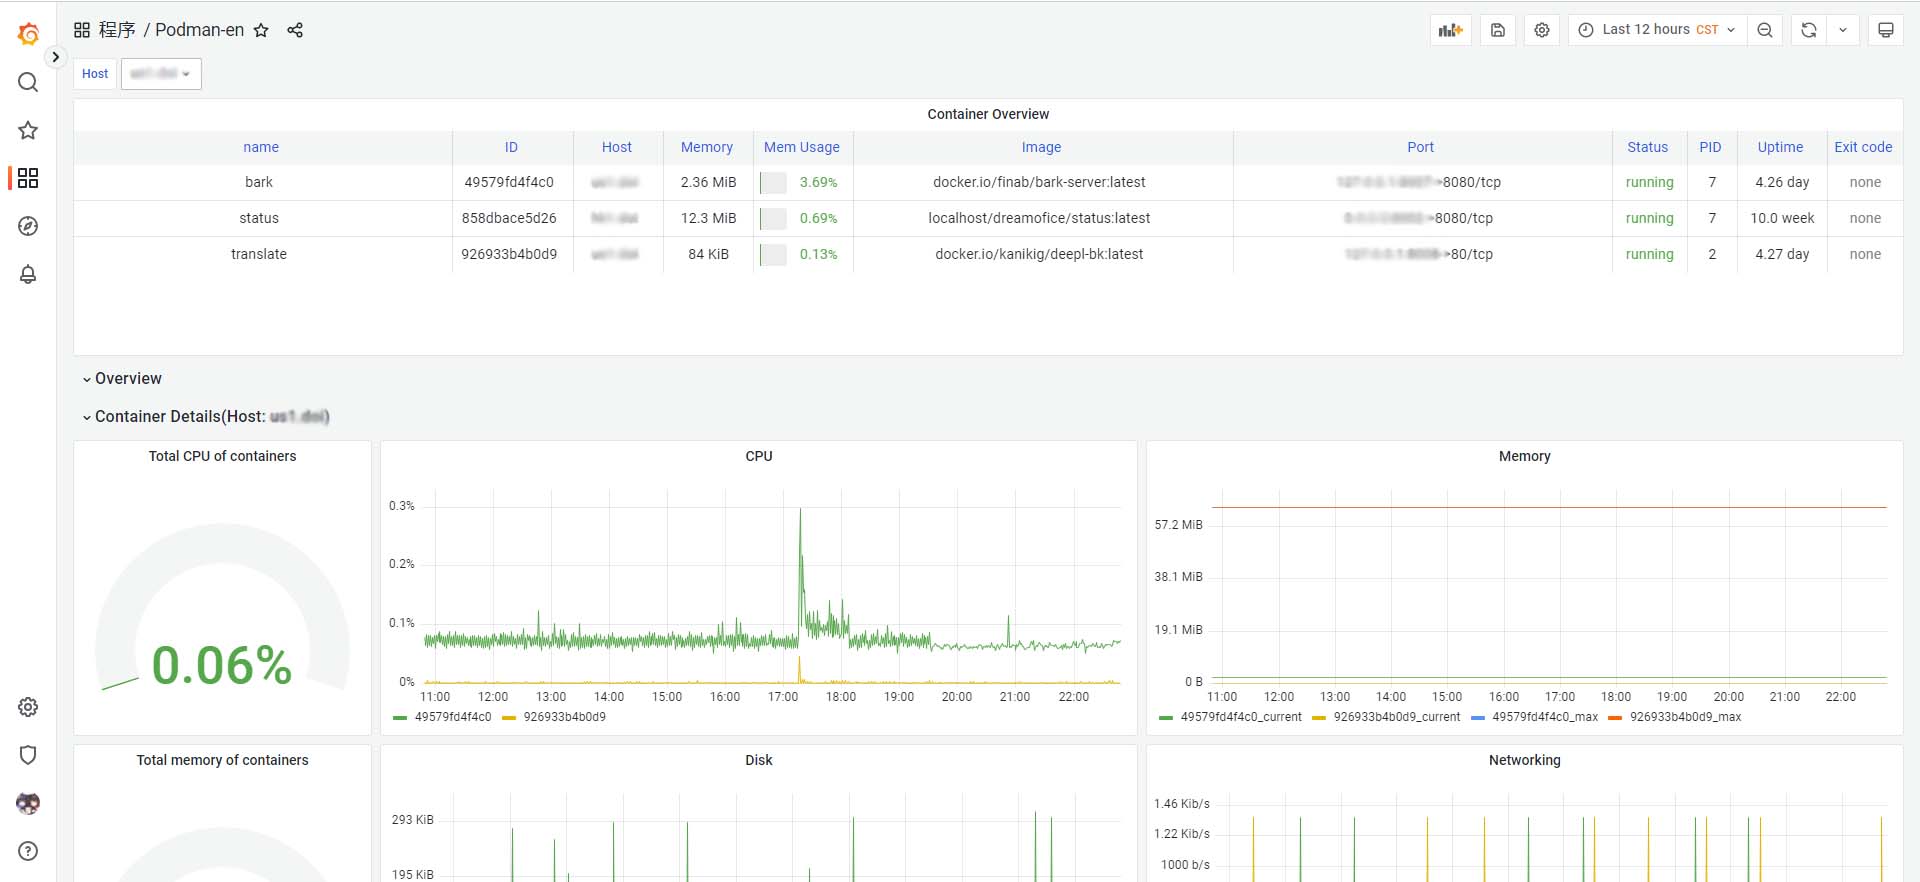
Grafana Podman Dashboard
A Grafana dashboard for use with prometheus-podman-export, available in both Chinese and English.
It allows to visualize information about containers and images
How to use
- Install and run prometheus-podman-exporter.
- Import the dashboard:
- Use
grafana.com:Link: Podman Dashboard EN
Dashboard ID:17639 - Or import json manually: dashboard-json
- Enjoy it!
License
MIT
Data source config
Collector type:
Collector plugins:
Collector config:
Revisions
Upload an updated version of an exported dashboard.json file from Grafana
| Revision | Description | Created | |
|---|---|---|---|
| Download |