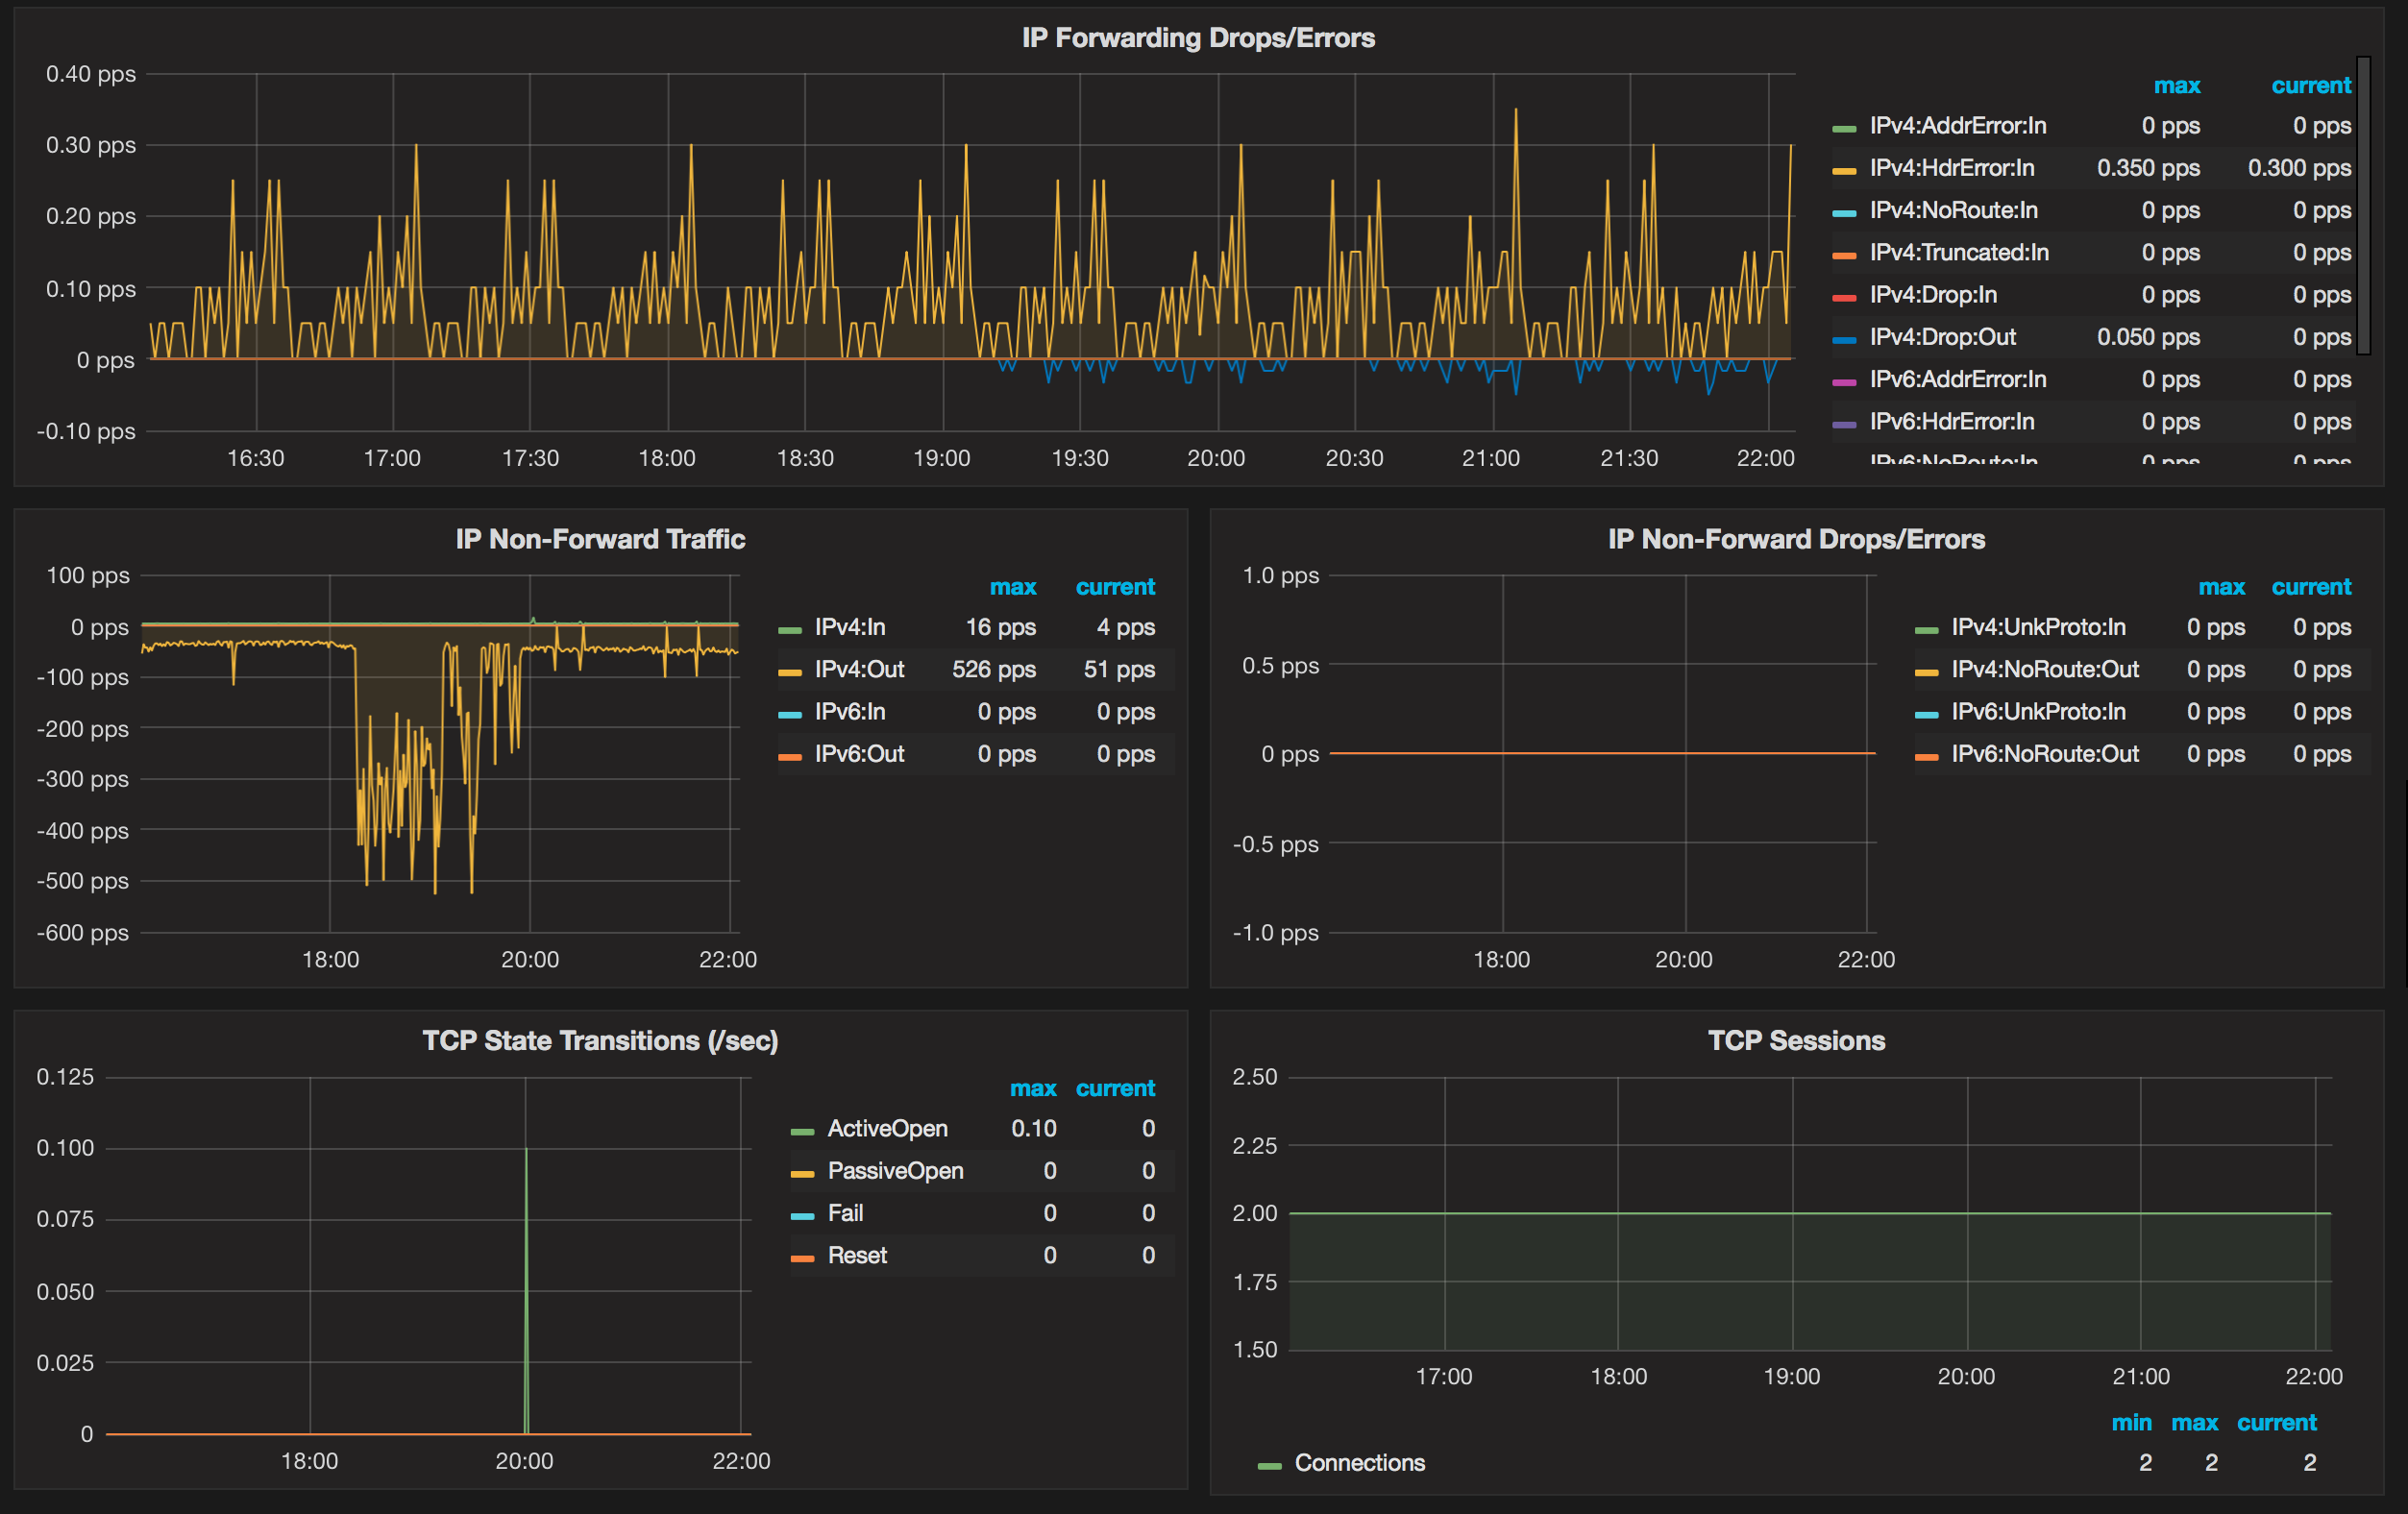
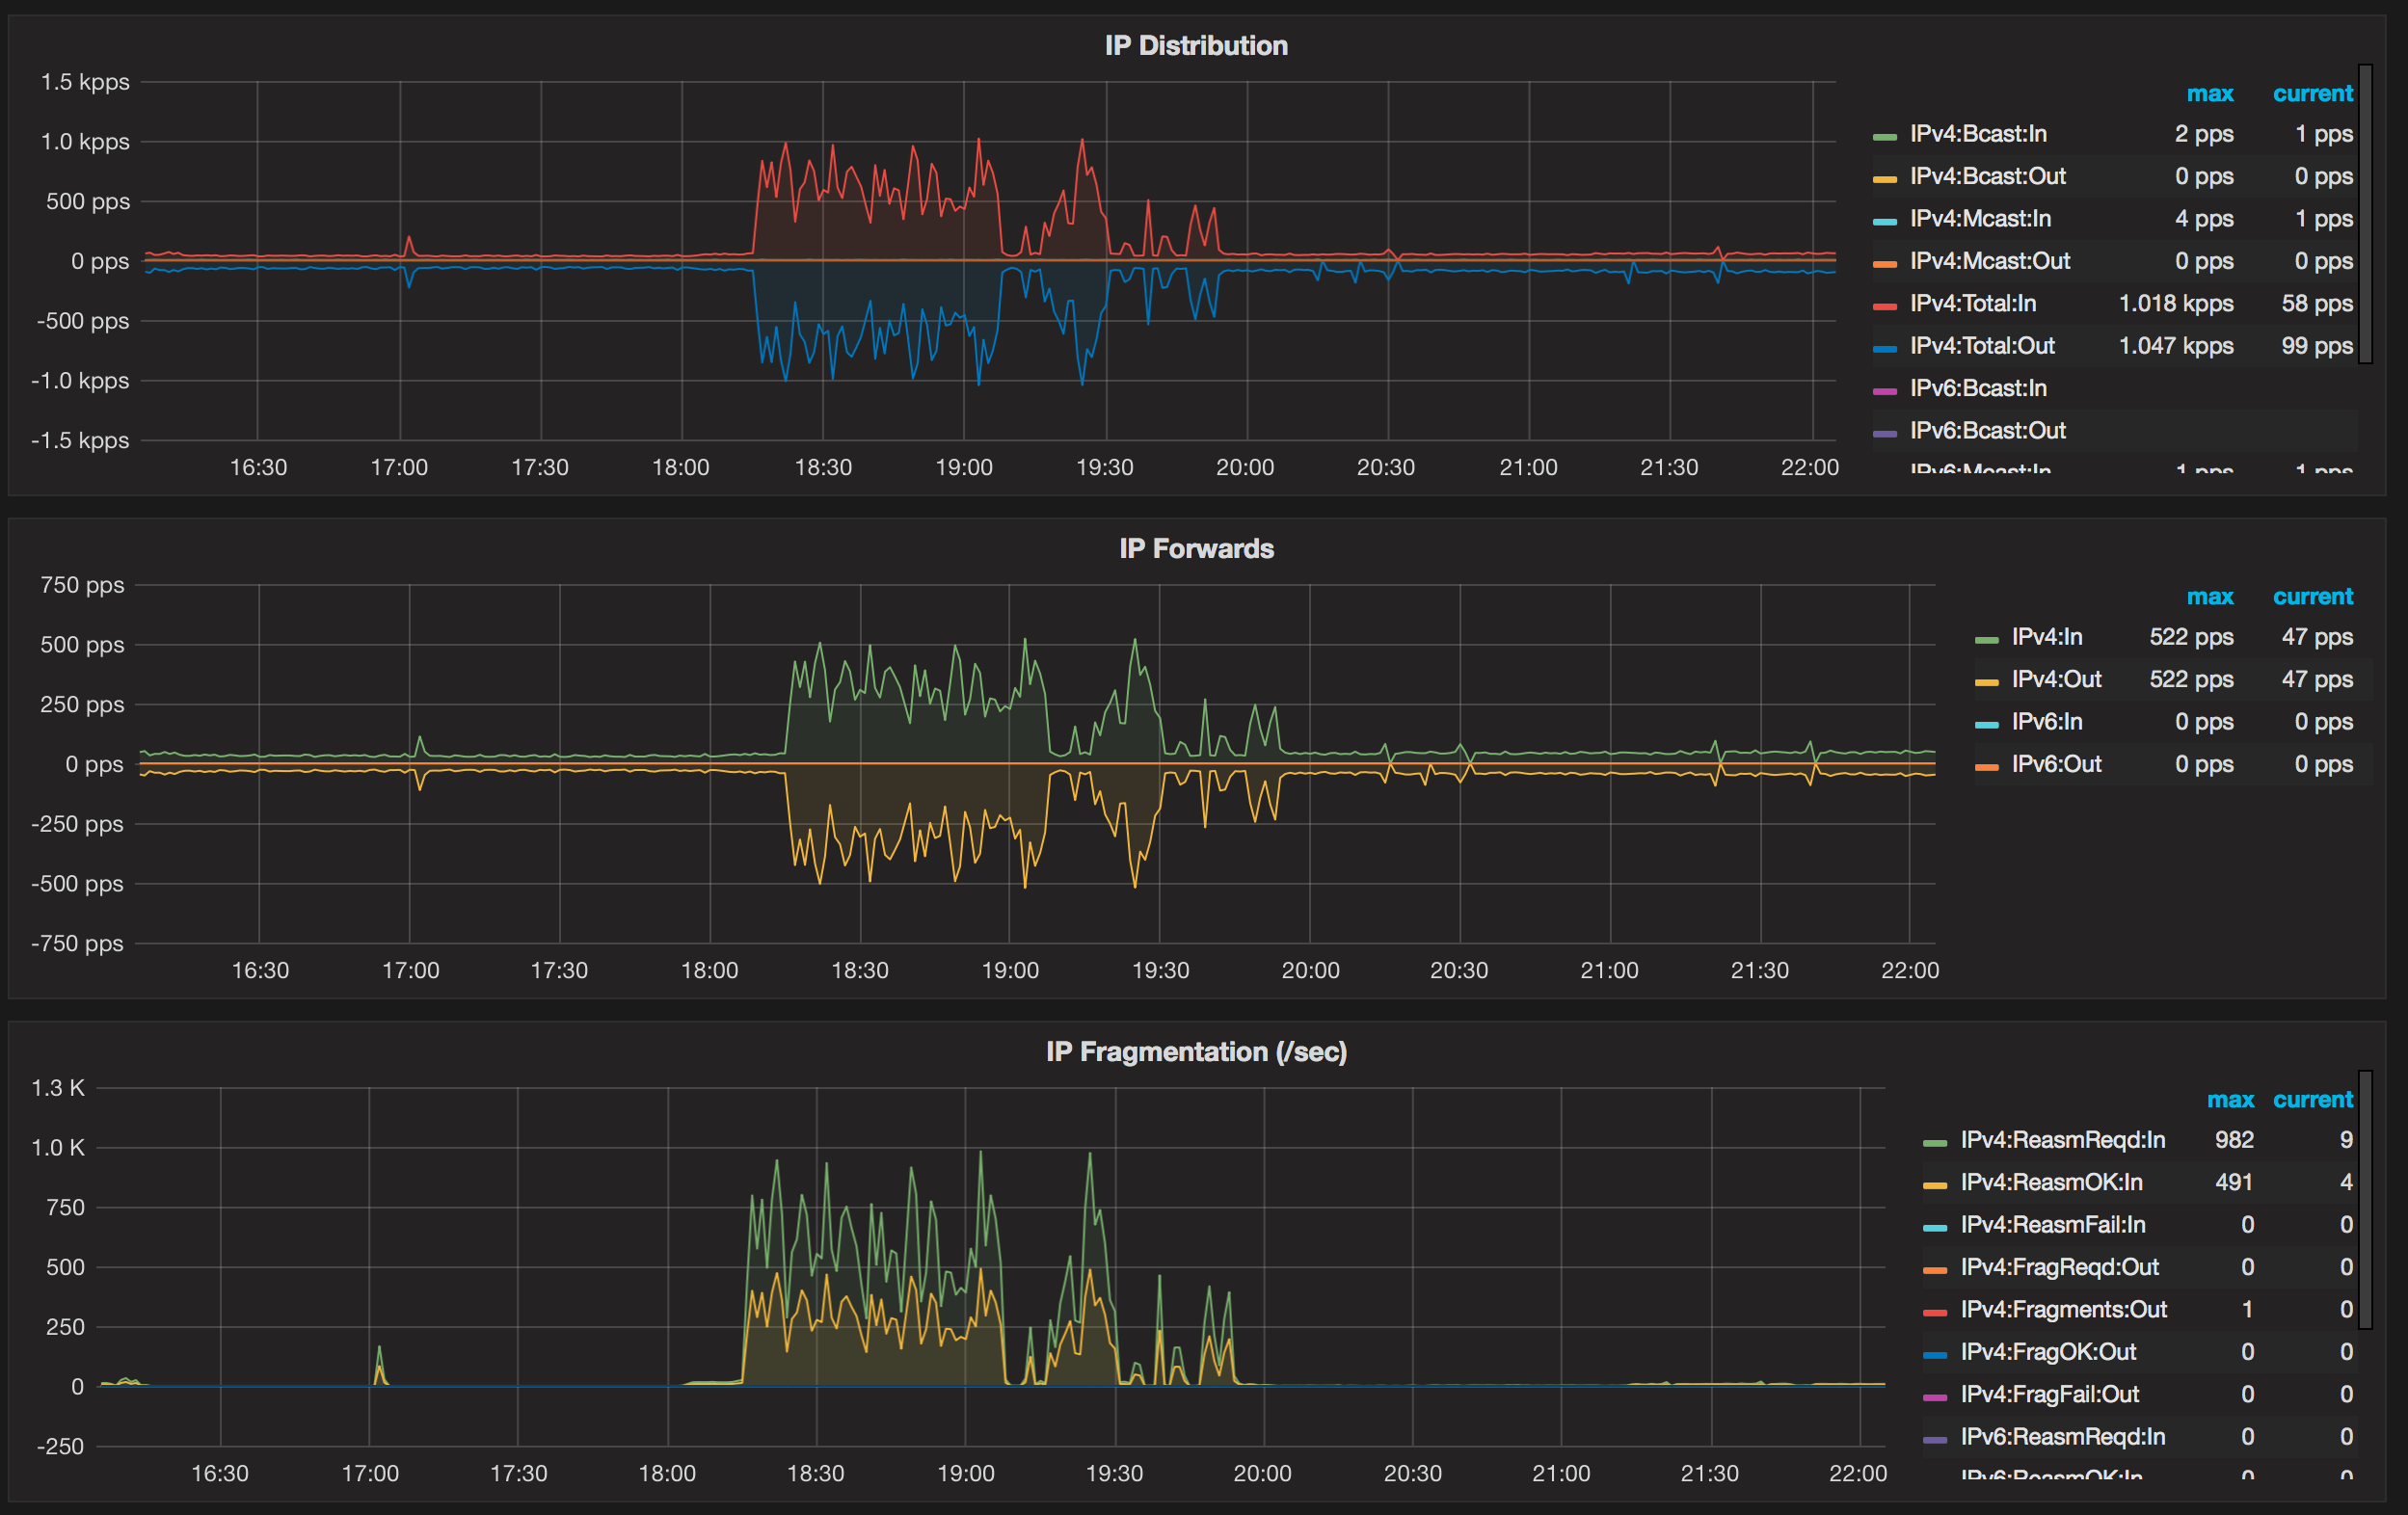
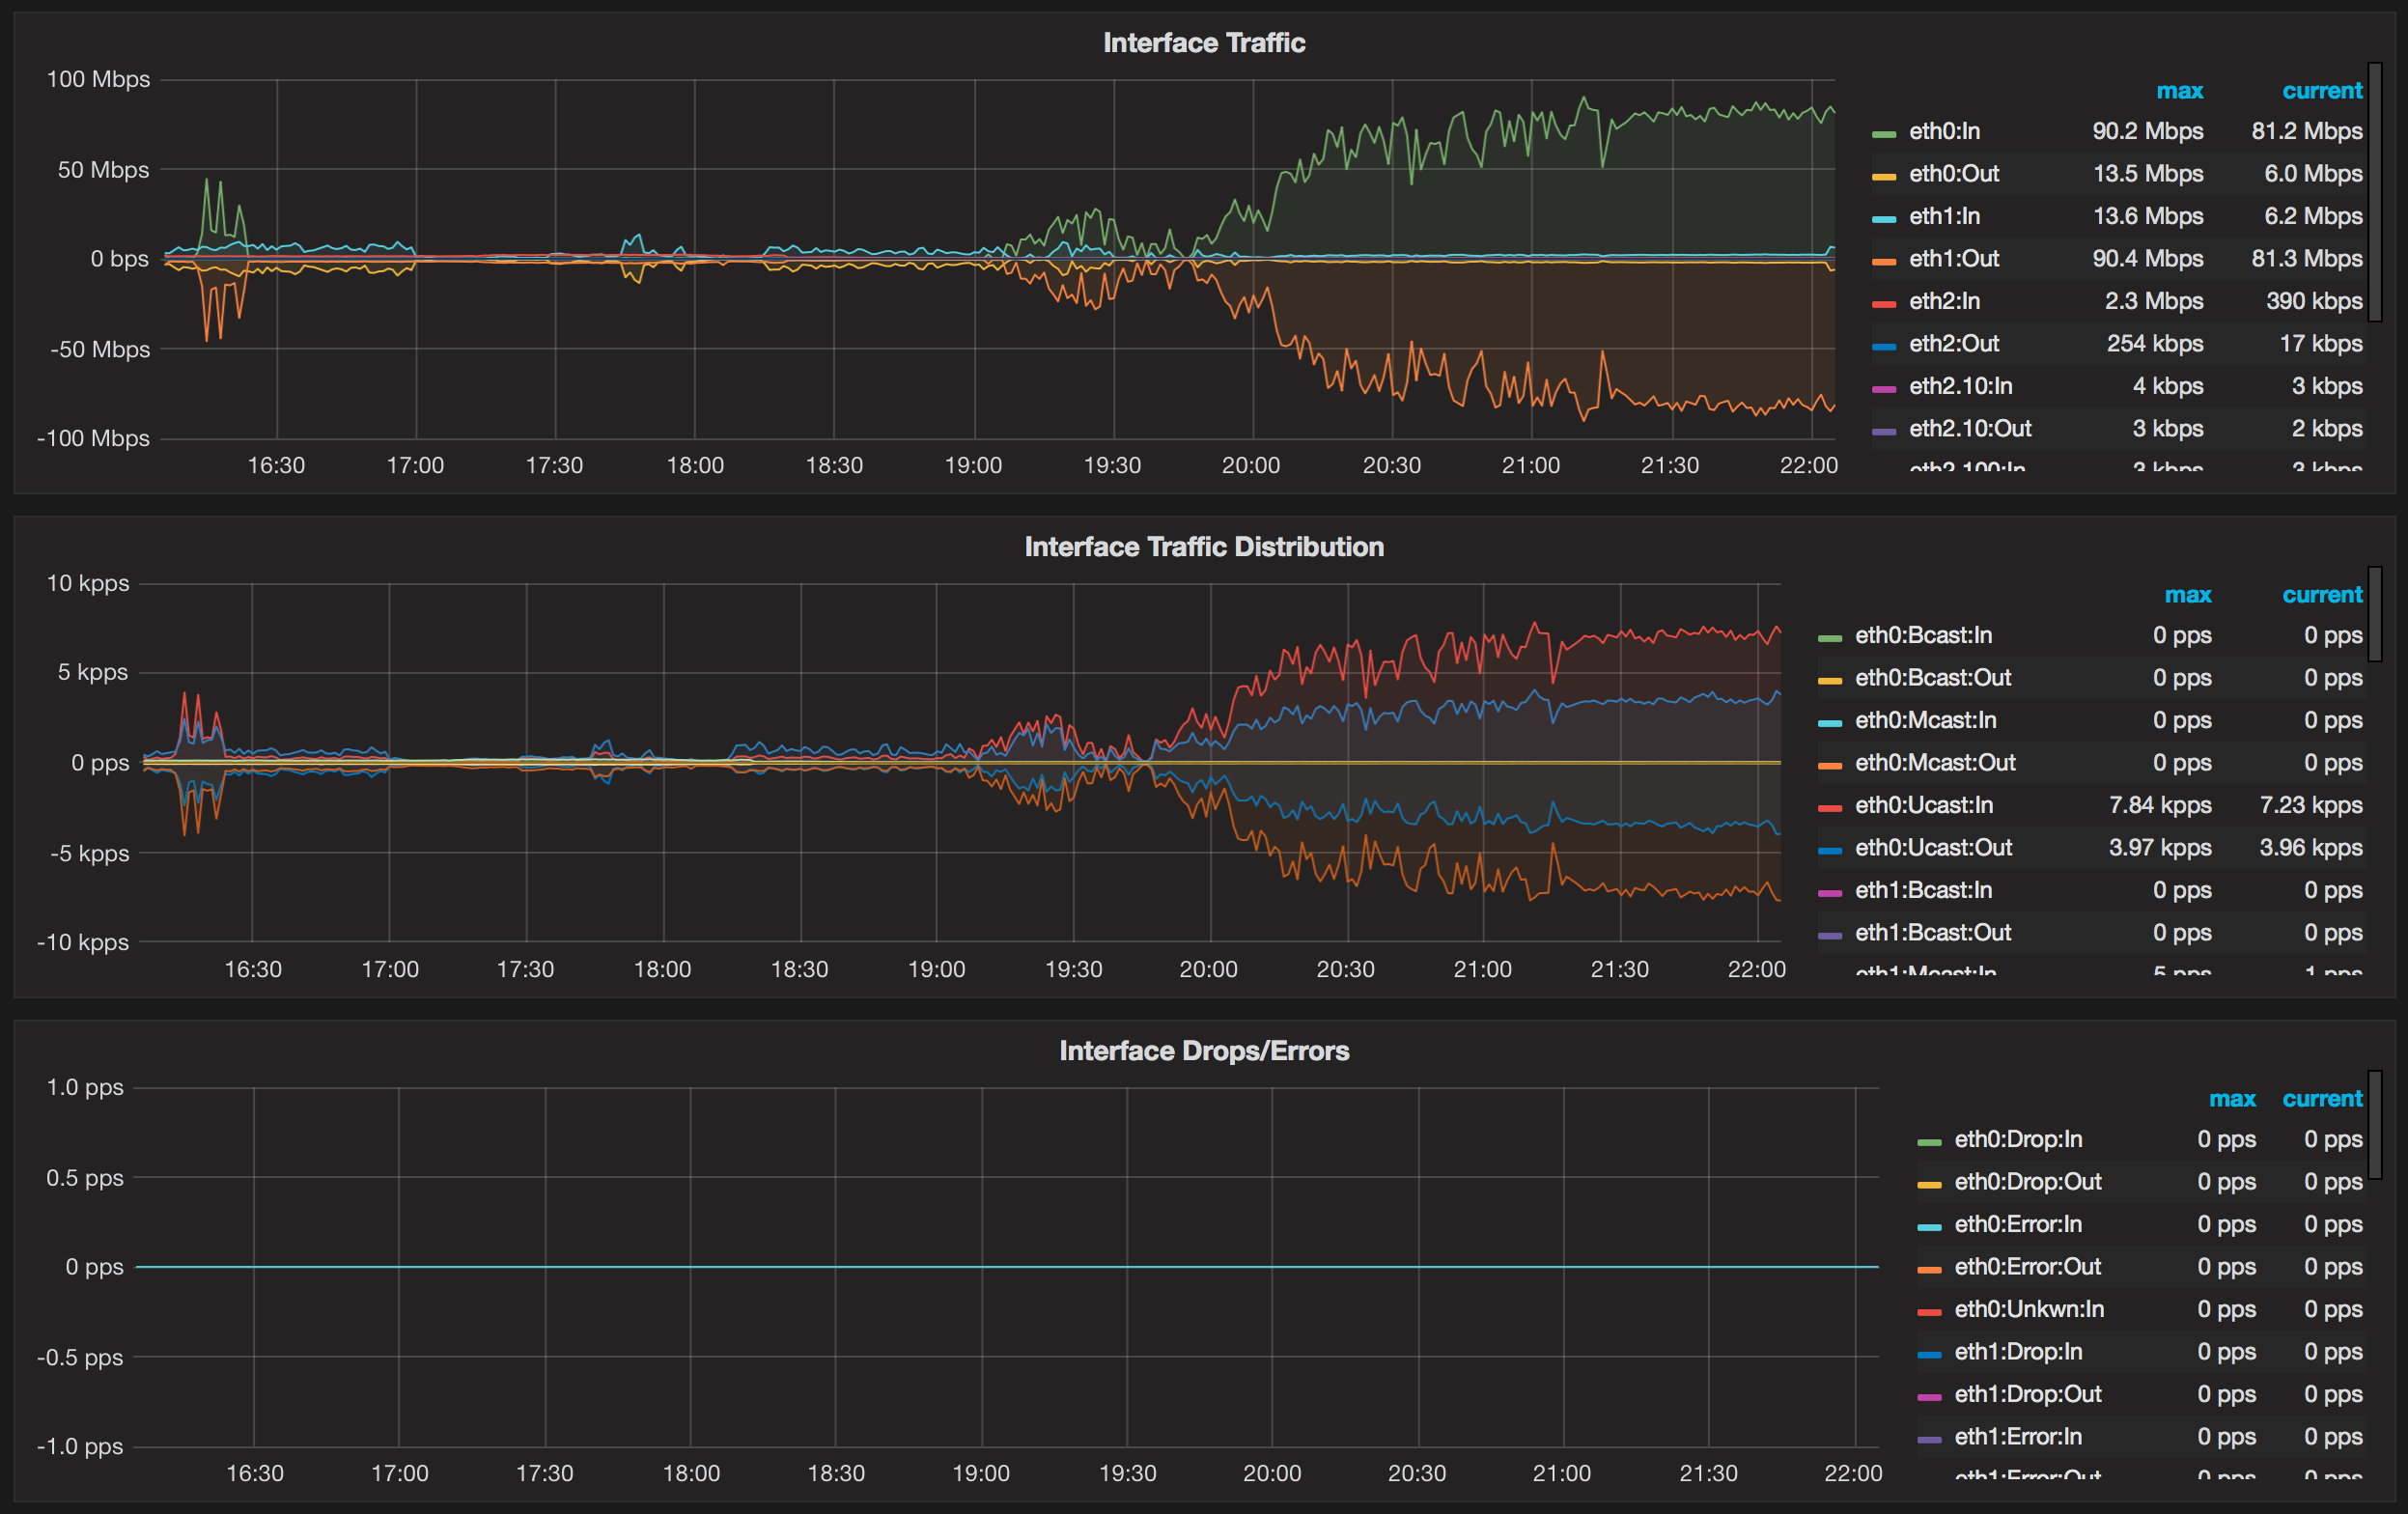
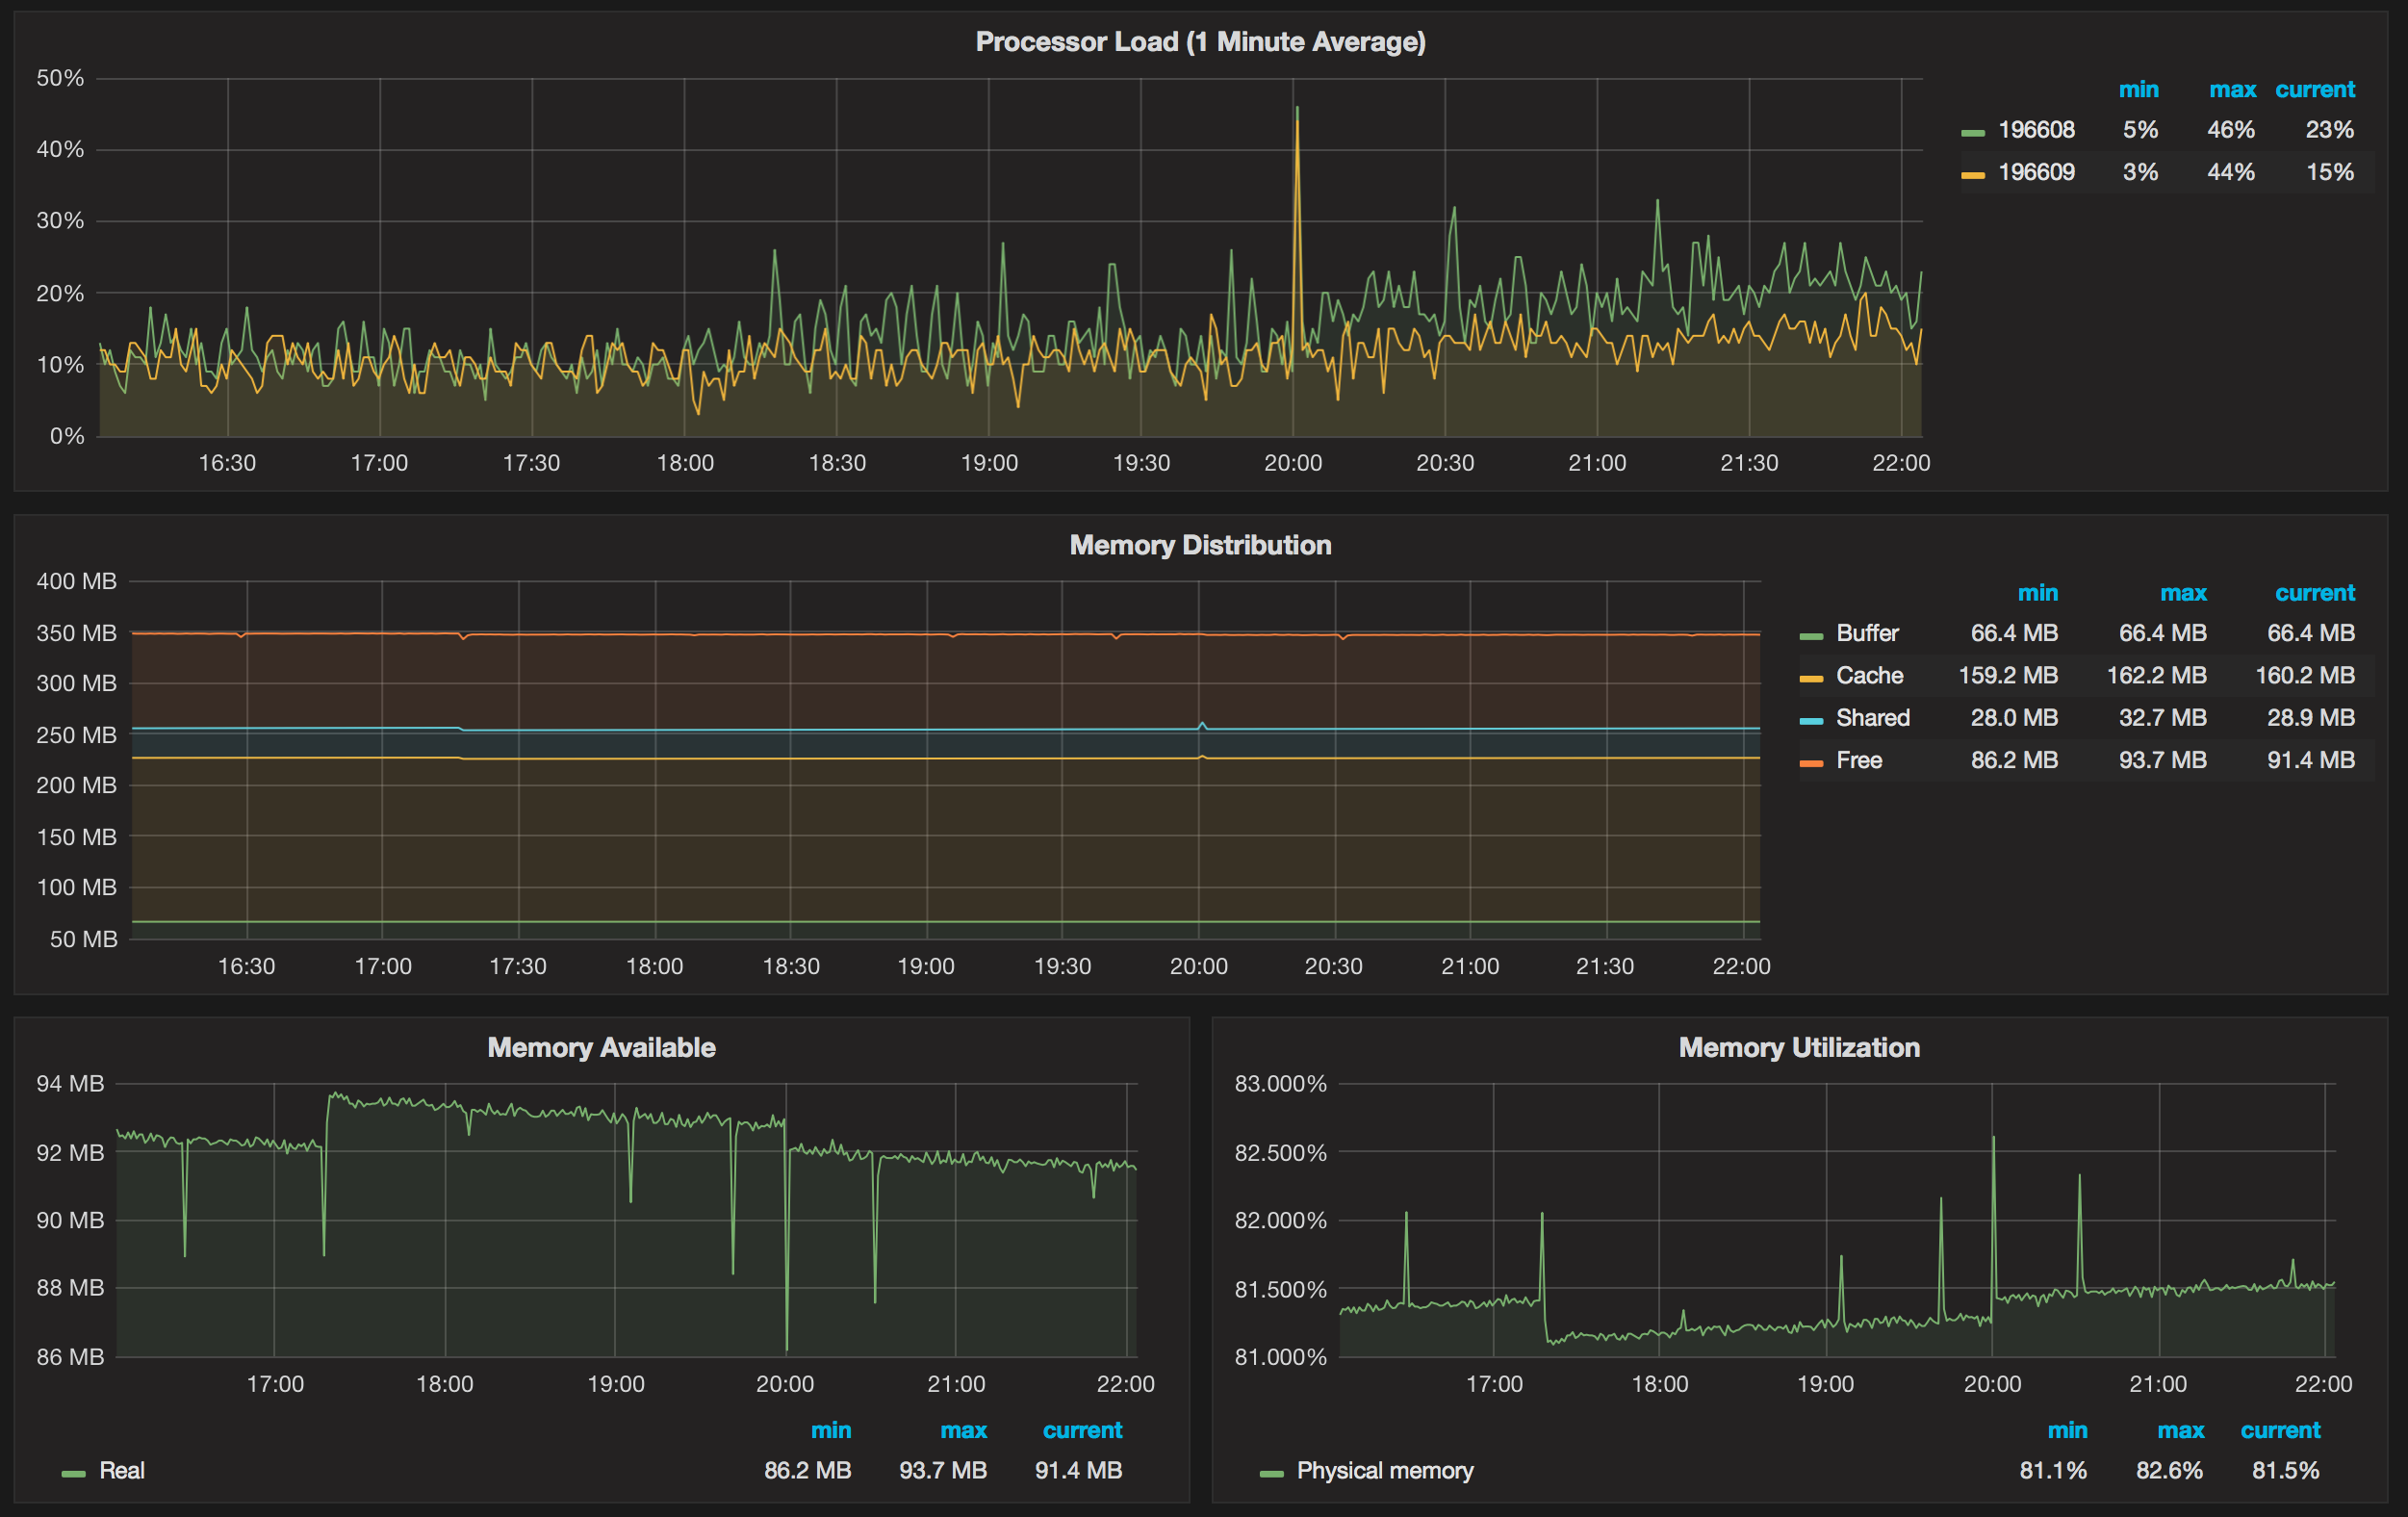
UBNT EdgeRouter Dashboard
UBNT EdgeRouter Templated Dashboard
Templated Grafana Dashboard for Ubiquiti Networks EdgeRouters
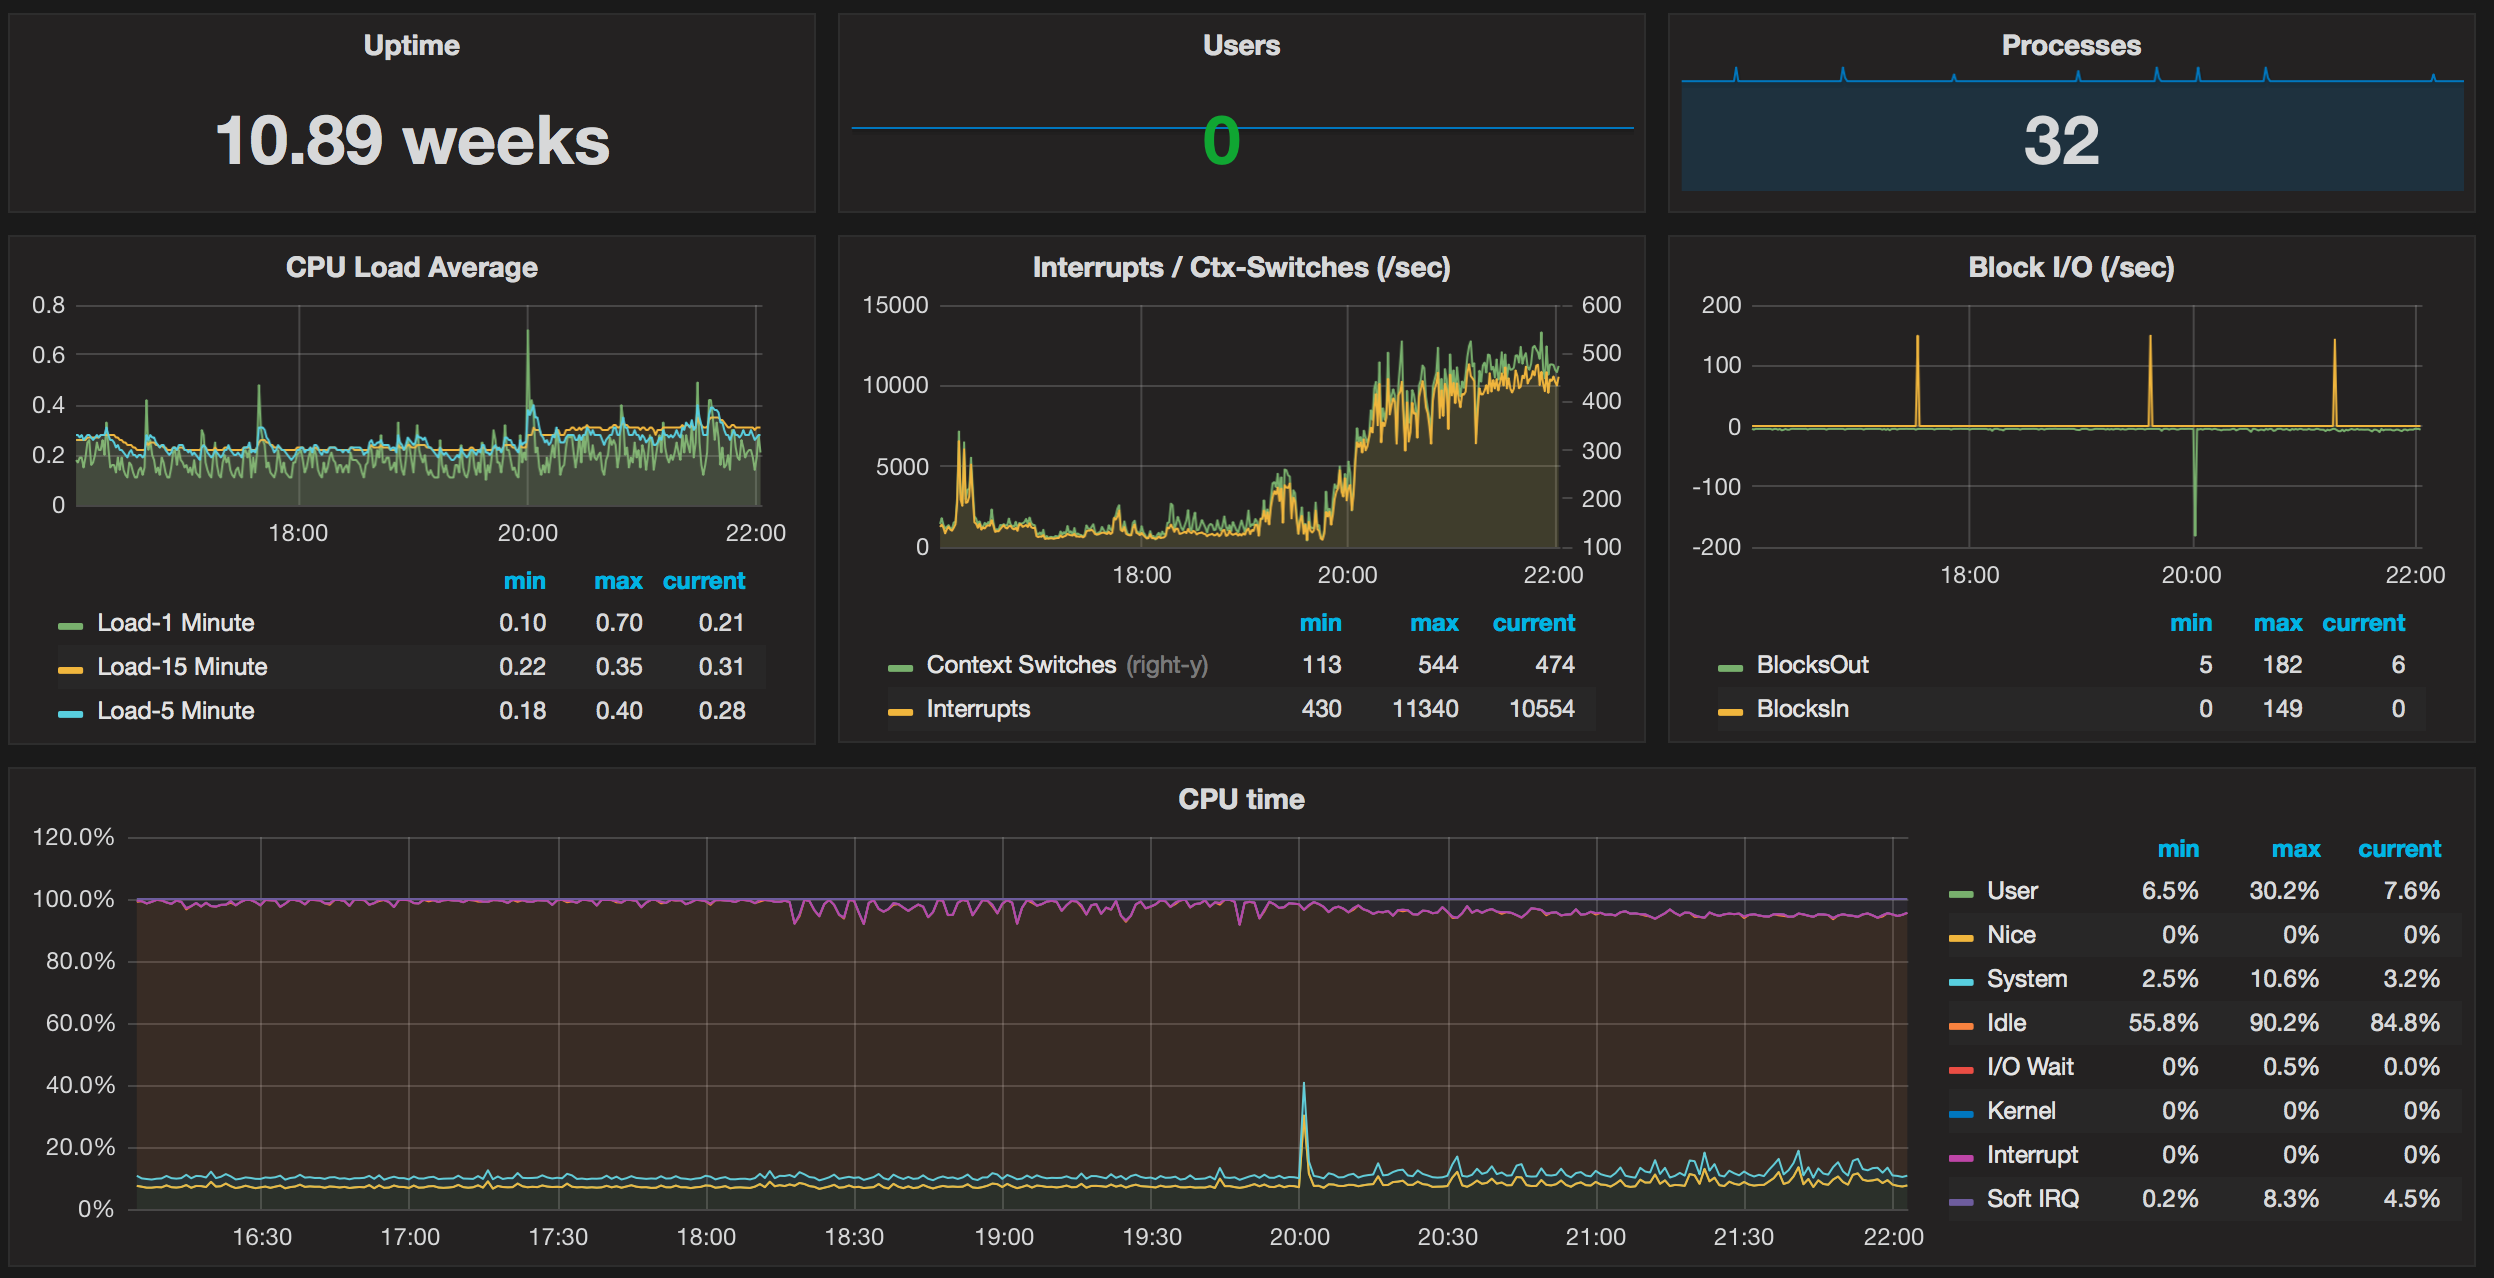
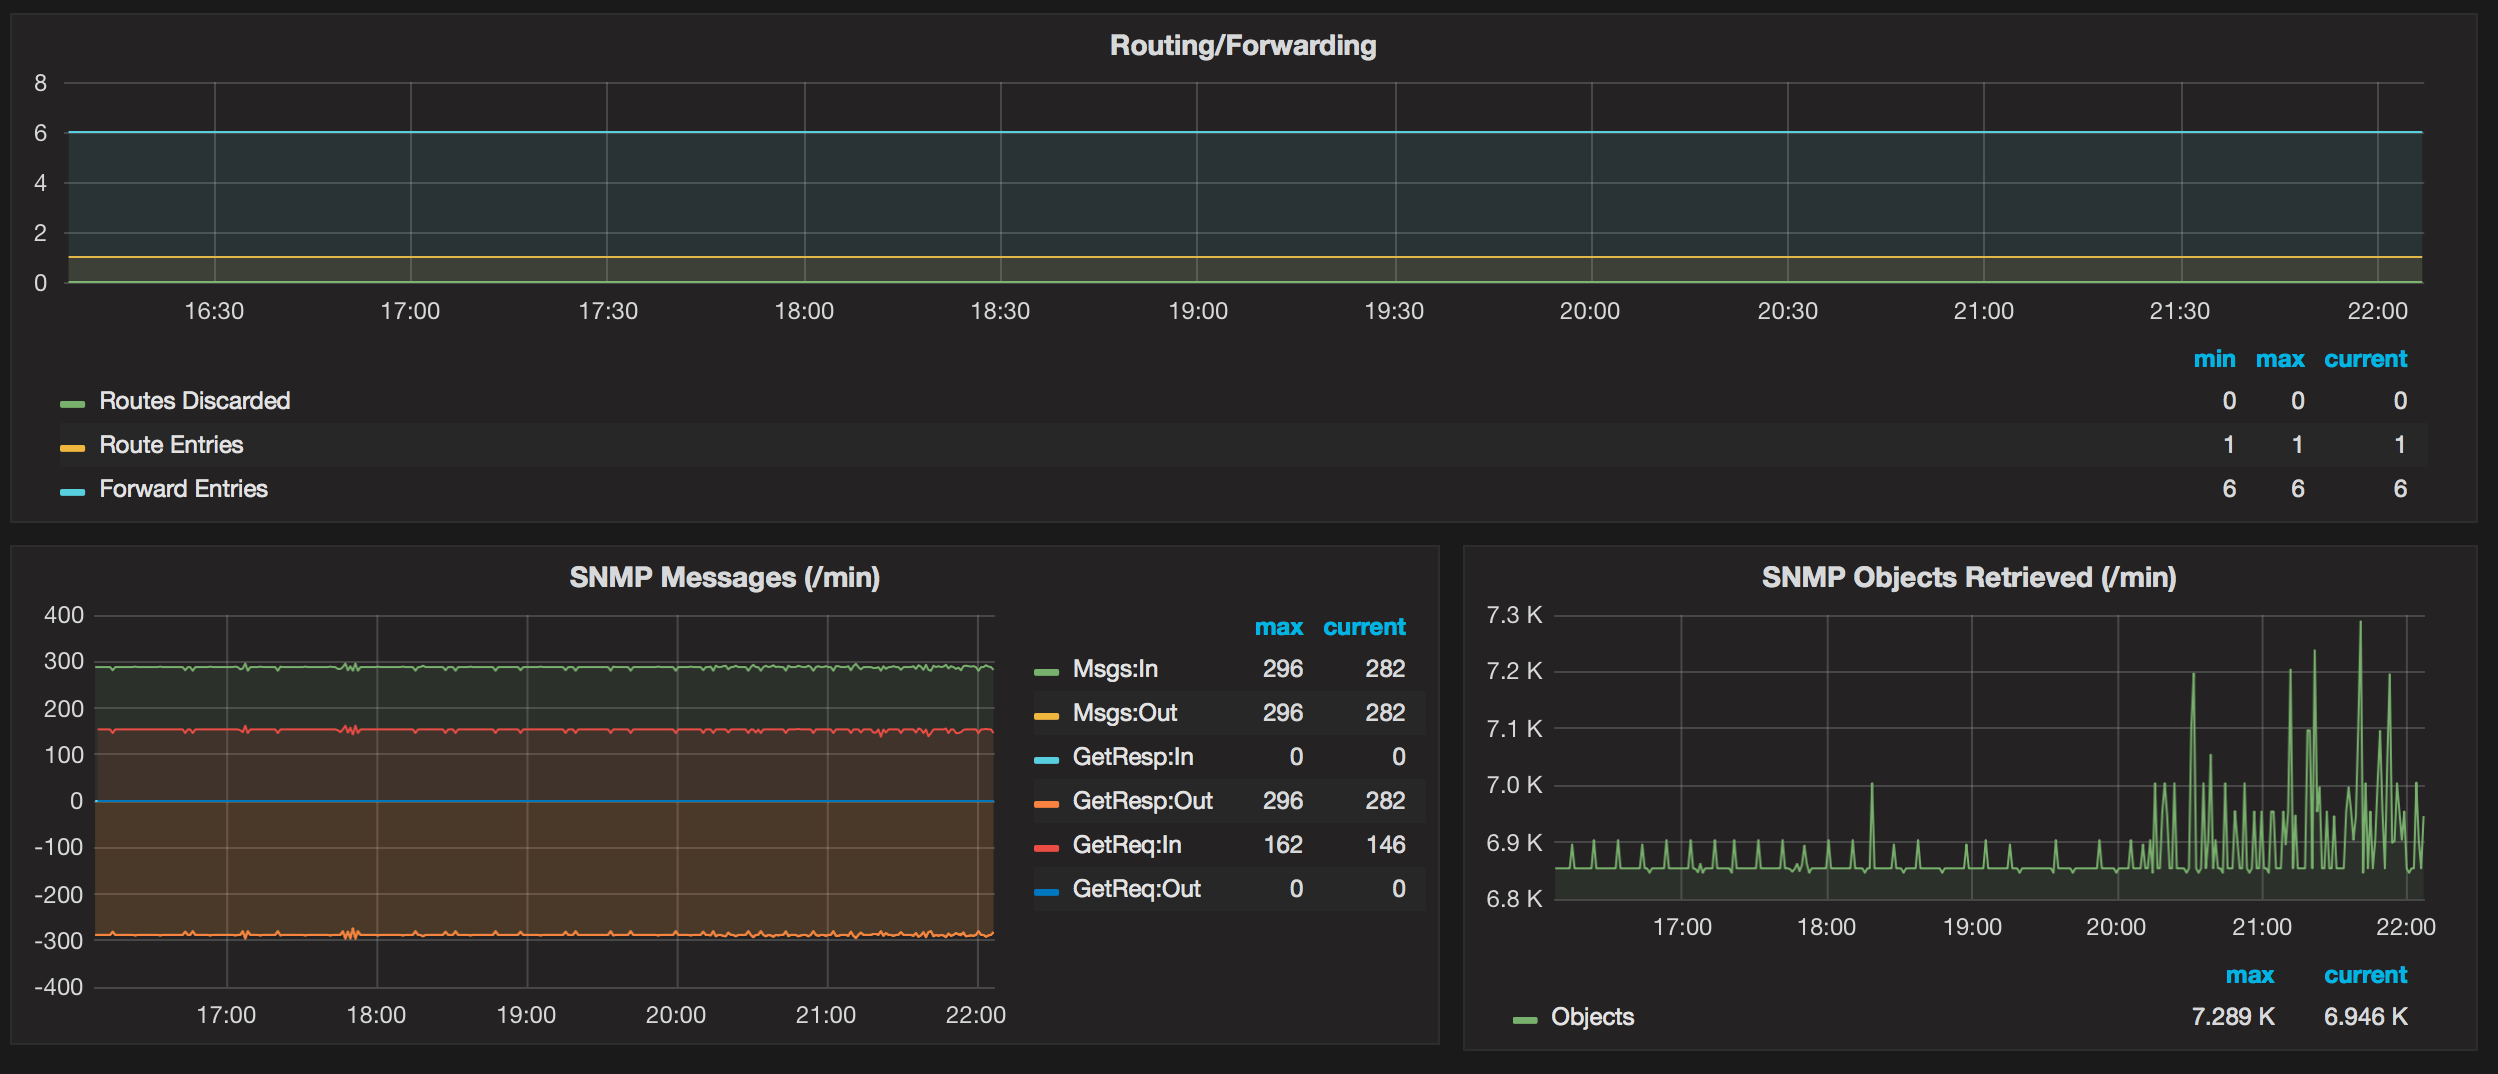
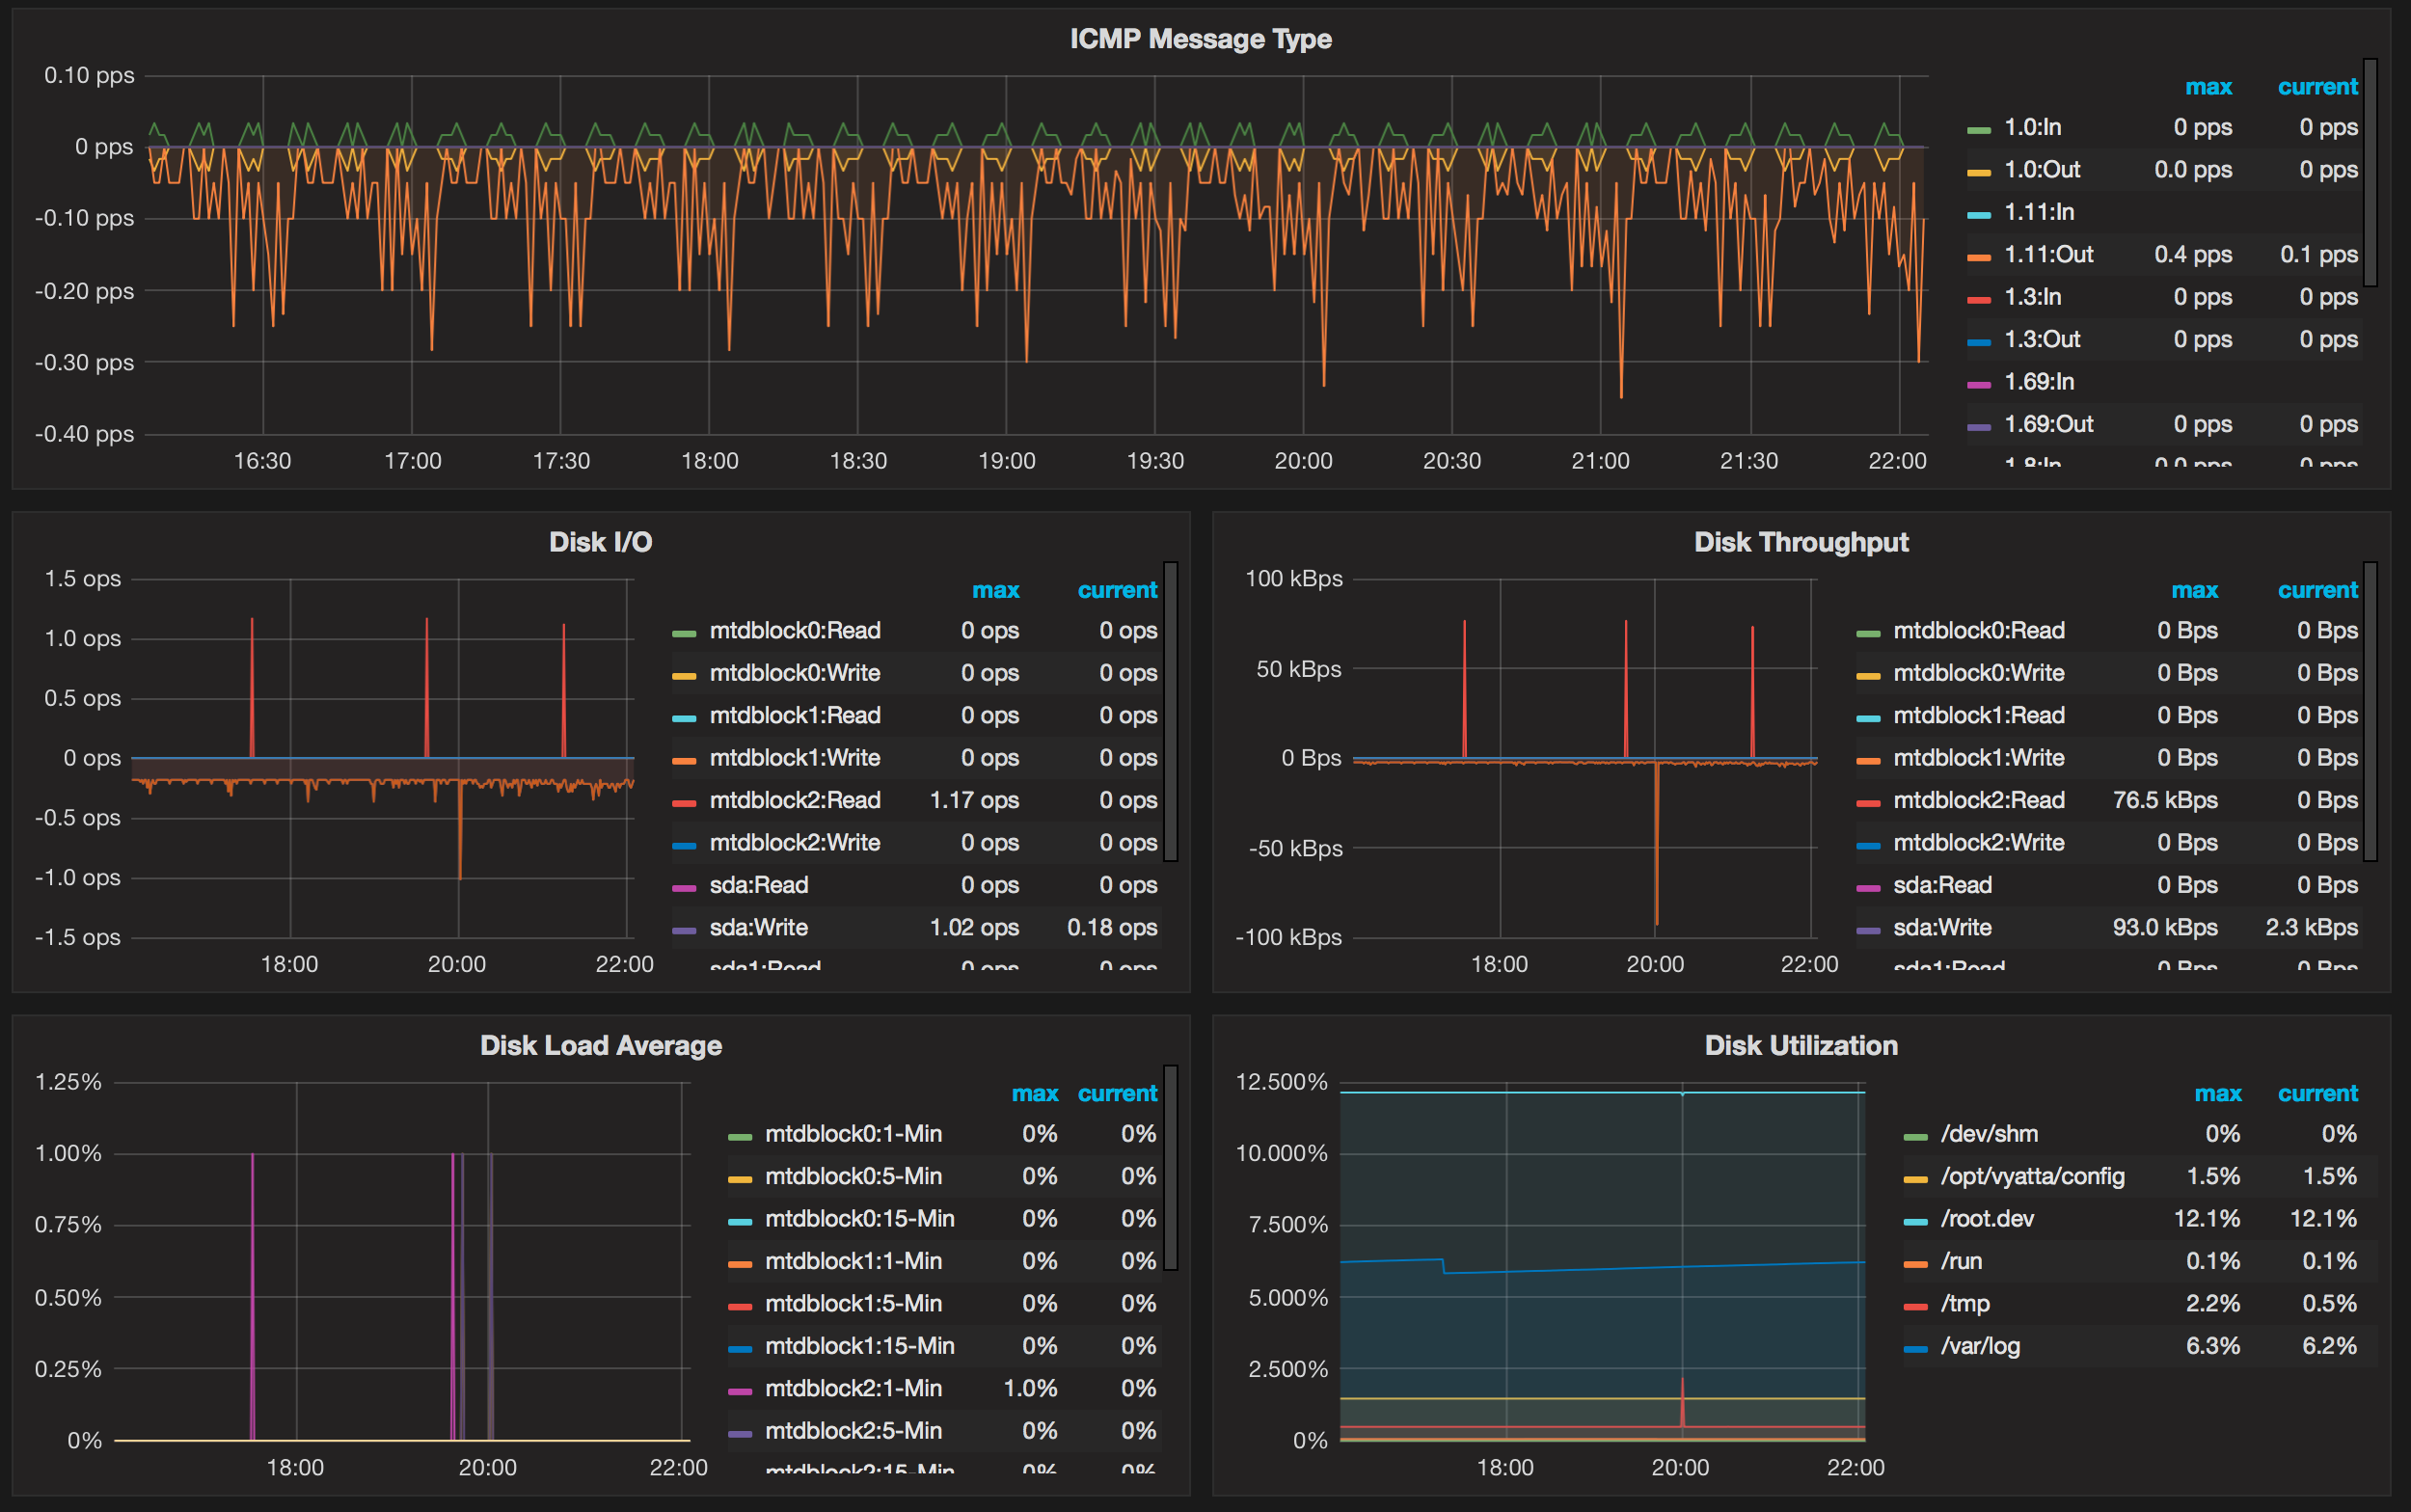
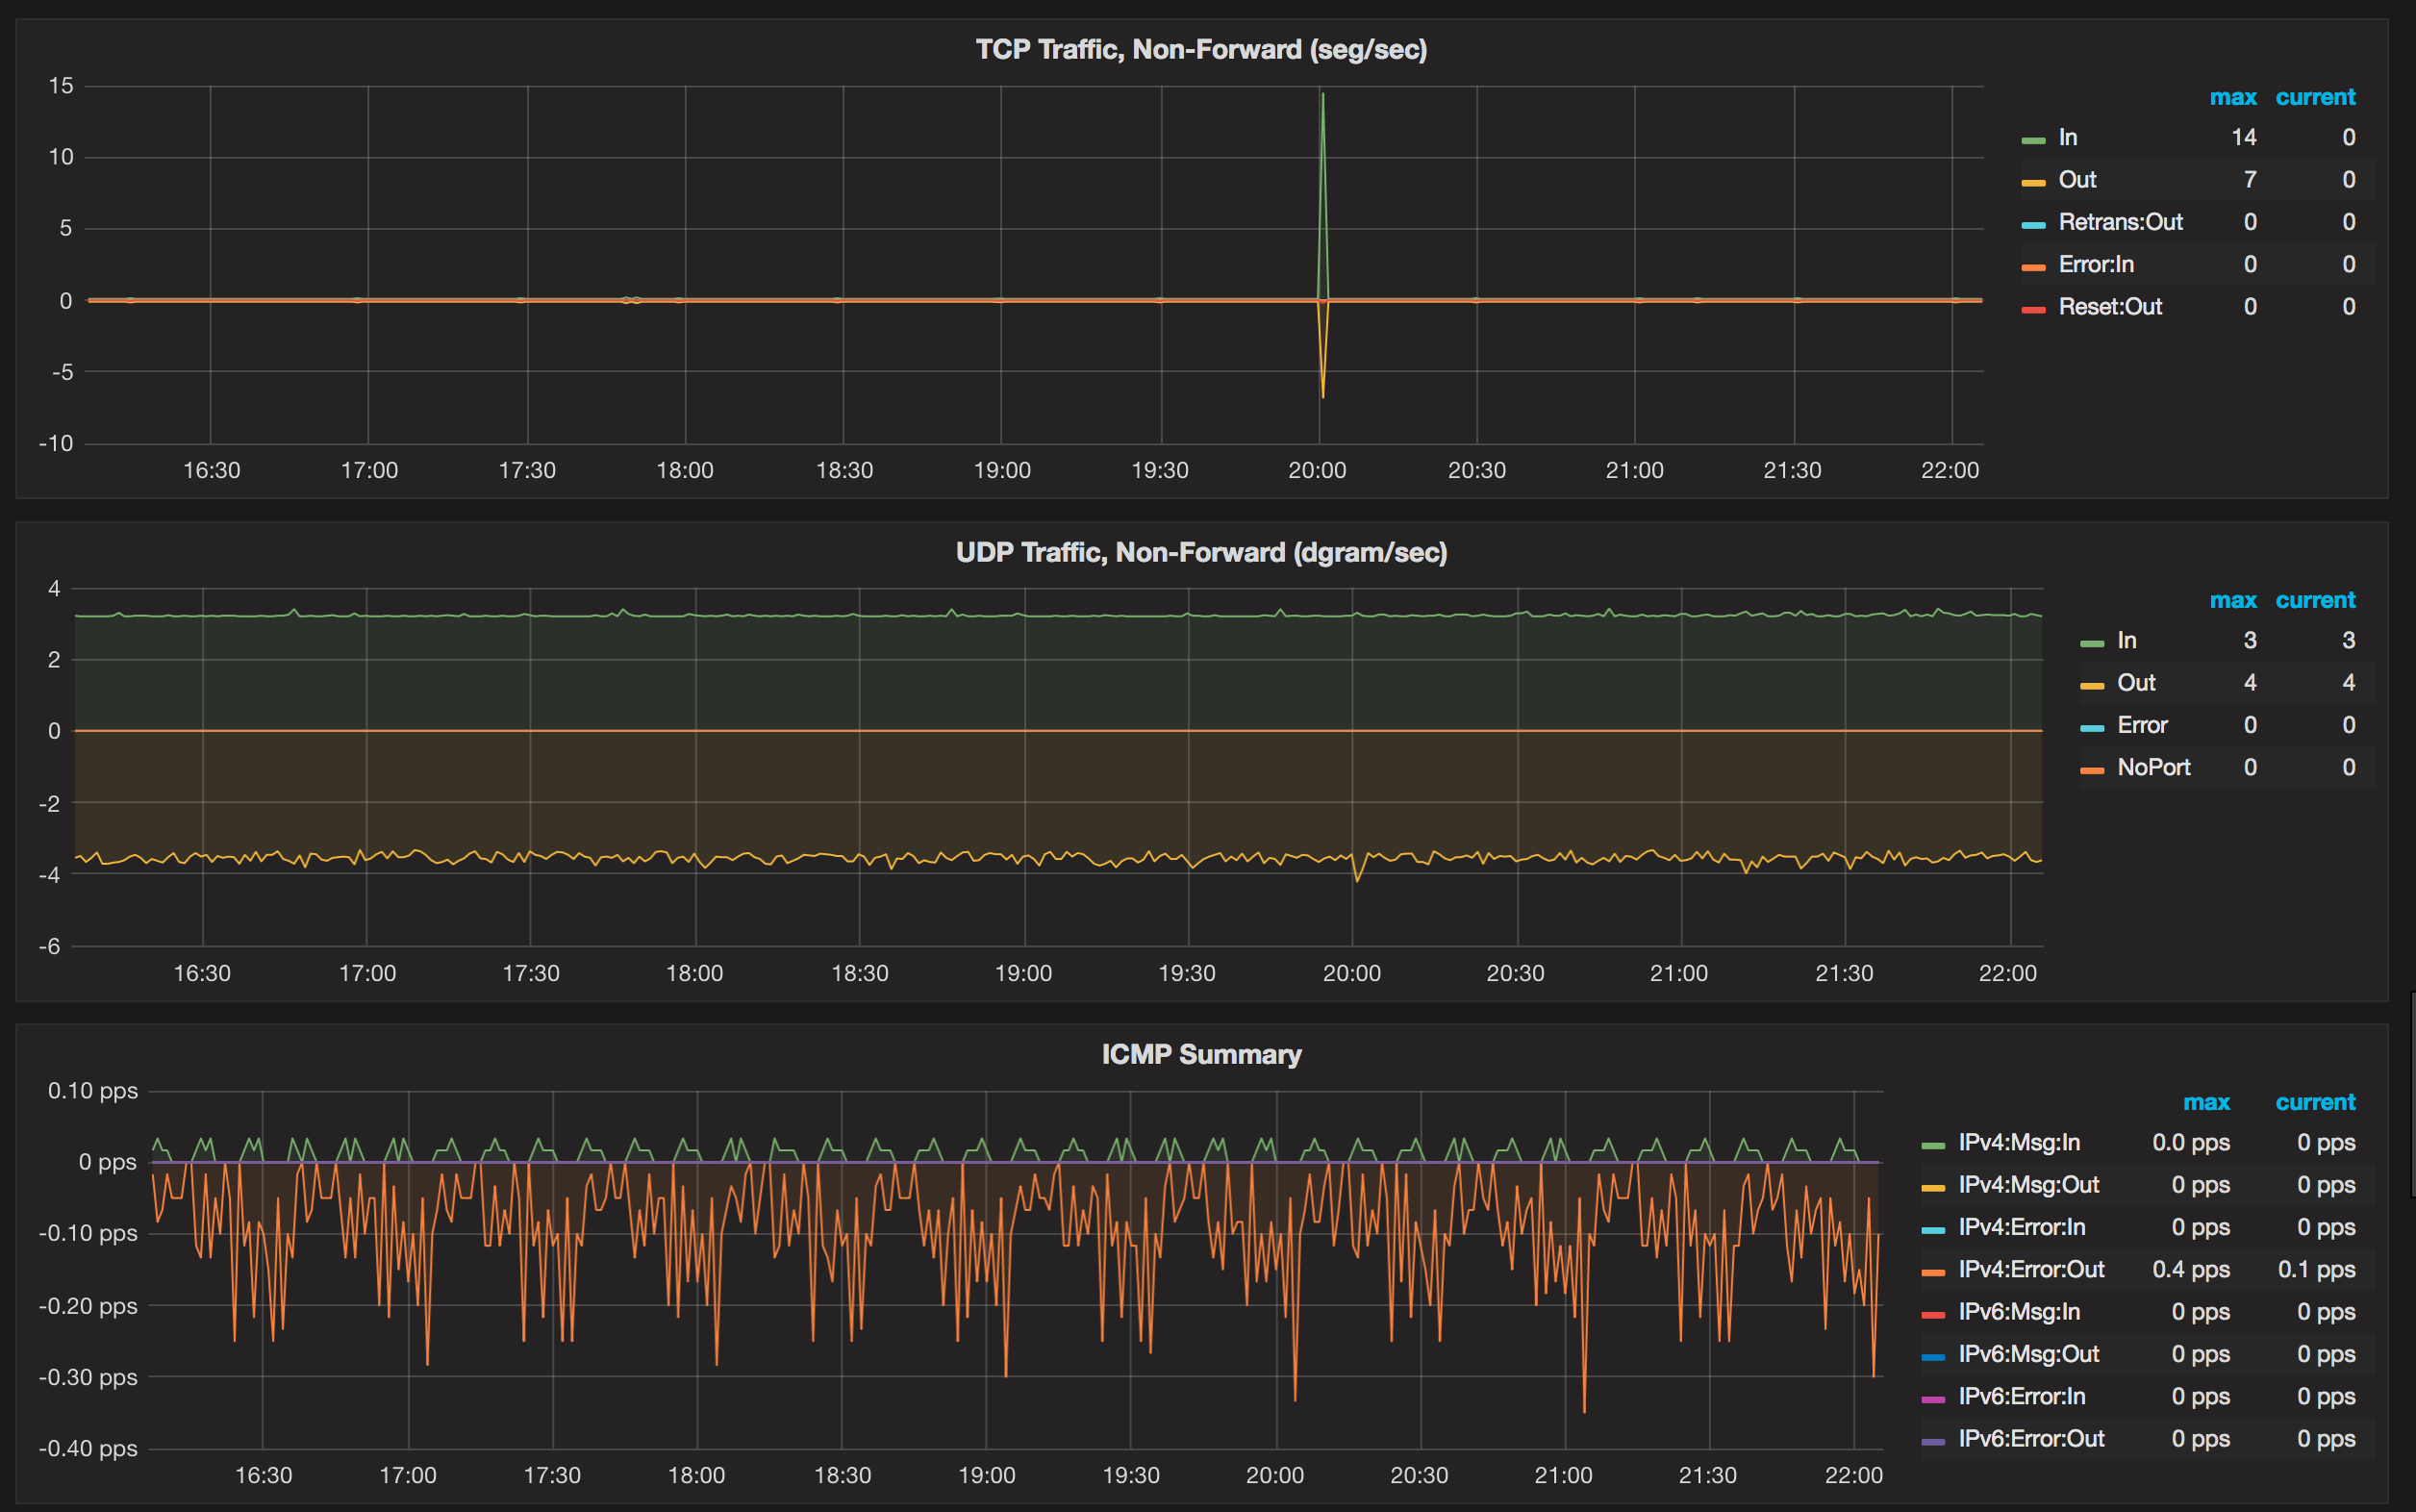
Detailed dashboard for monitoring of Ubiquiti EdgeRouters via SNMP.
The Telegraf collector configuration is MIB-based so all of the required MIBs will need to be available for the collector to perform the needed translations. Most SNMP distributions available on most platforms already provide these. This configuration uses the "new" SNMP plugin for Telegraf, so SNMP monitoring must be enabled in the EdgeOS configurations. The 'agents' list in the configuration is of the actual EdgeRouters themselves.
Important Dependency Note
The included Telegraf:SNMP plugin configuration depends upon a feature (flag 'index_as_tag') that is not part of the released Telegraf 1.2. Several collected object tables leverage a non-accessible index, such as to identify the IP Version for the statistics in each row. The actual index is the sub-id for each table element, of which the Telegraf:SNMP plugin does not currently make available as a field or tag. However this capability (PR #2366 ) has been added/merged to the latest Telegraf source targeted for the next formal release.
There are three options for the interim until the next formal release:
- Wait for a formal release of Telegraf with the needed support. The noted PR is tagged for the Telegraf v1.3 milestone.
- Use a current nightly build, if available.
- Build custom version of Telegraf using the github influxdata/telegraf master branch. This is actually a straightforward and relatively easy process.
Dependencies
Notes
As with any SNMP-based monitoring solution with EdgeRouters, IP forwarding statistics will not reflect packets that have been hardware-offloaded.
References
This dashboard and dependent configurations may also be found at https://github.com/WaterByWind/grafana-dashboards
License
This dashboard is distributed under The MIT License (MIT)
Data source config
Collector config:
Upload an updated version of an exported dashboard.json file from Grafana
| Revision | Description | Created | |
|---|---|---|---|
| Download |
Ubiquiti EdgeRouter
Easily monitor Ubiquiti EdgeRouter with Grafana Cloud's out-of-the-box monitoring solution.
Learn more
