
SSH Logs
Loki v2/v3 SSH Logs
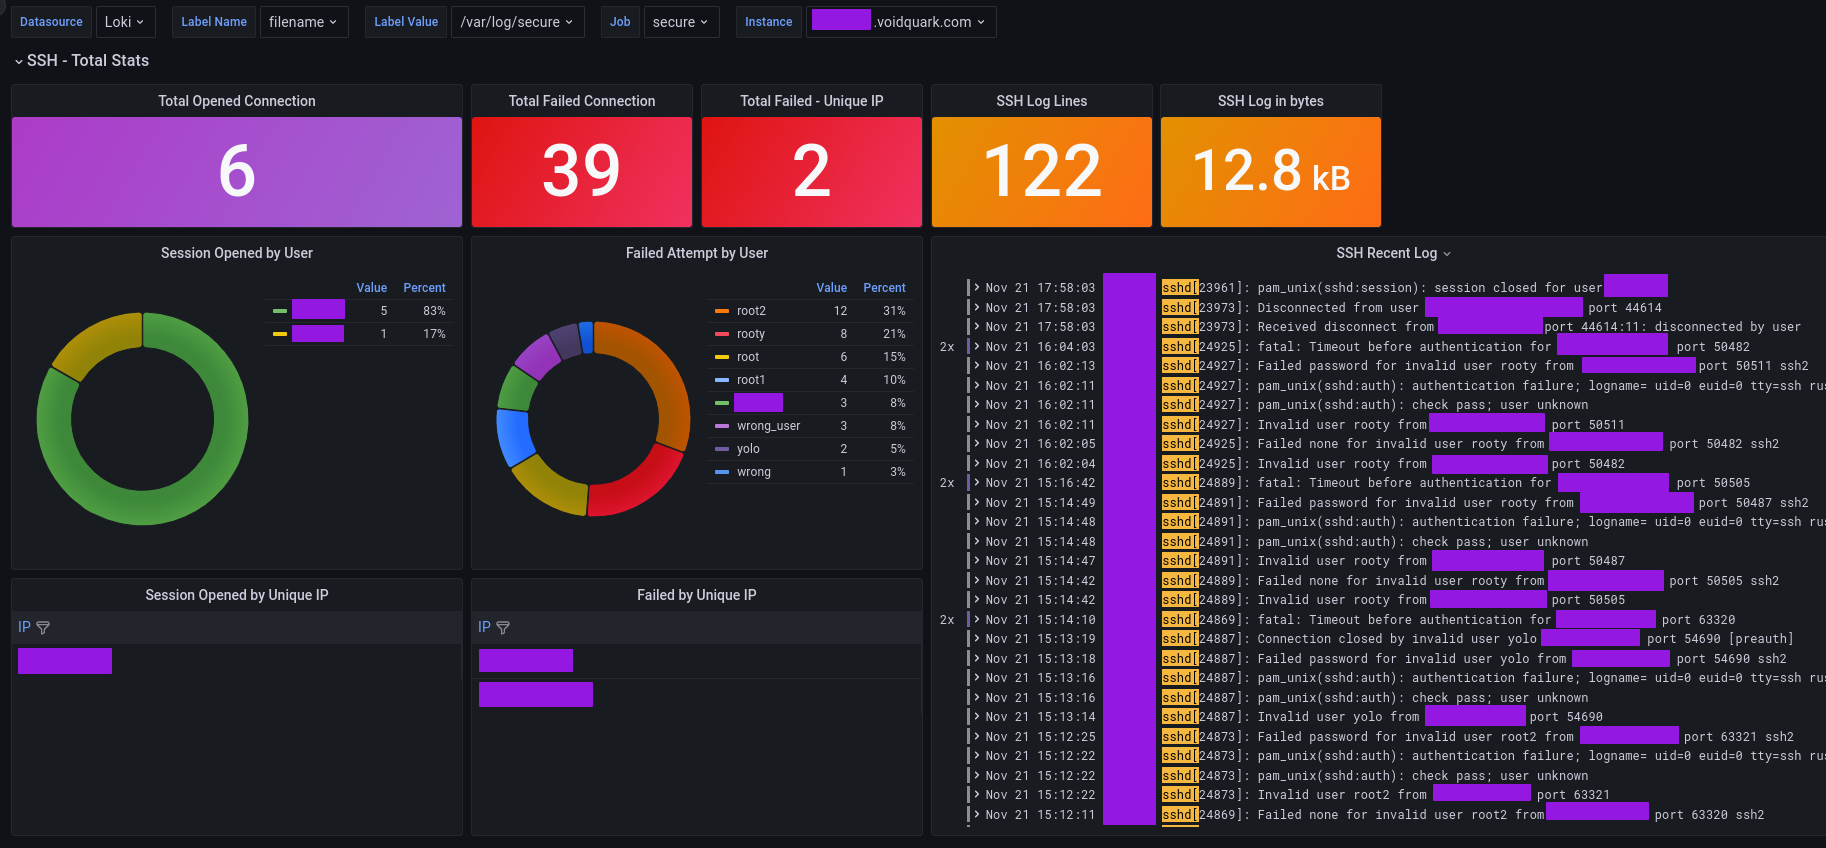
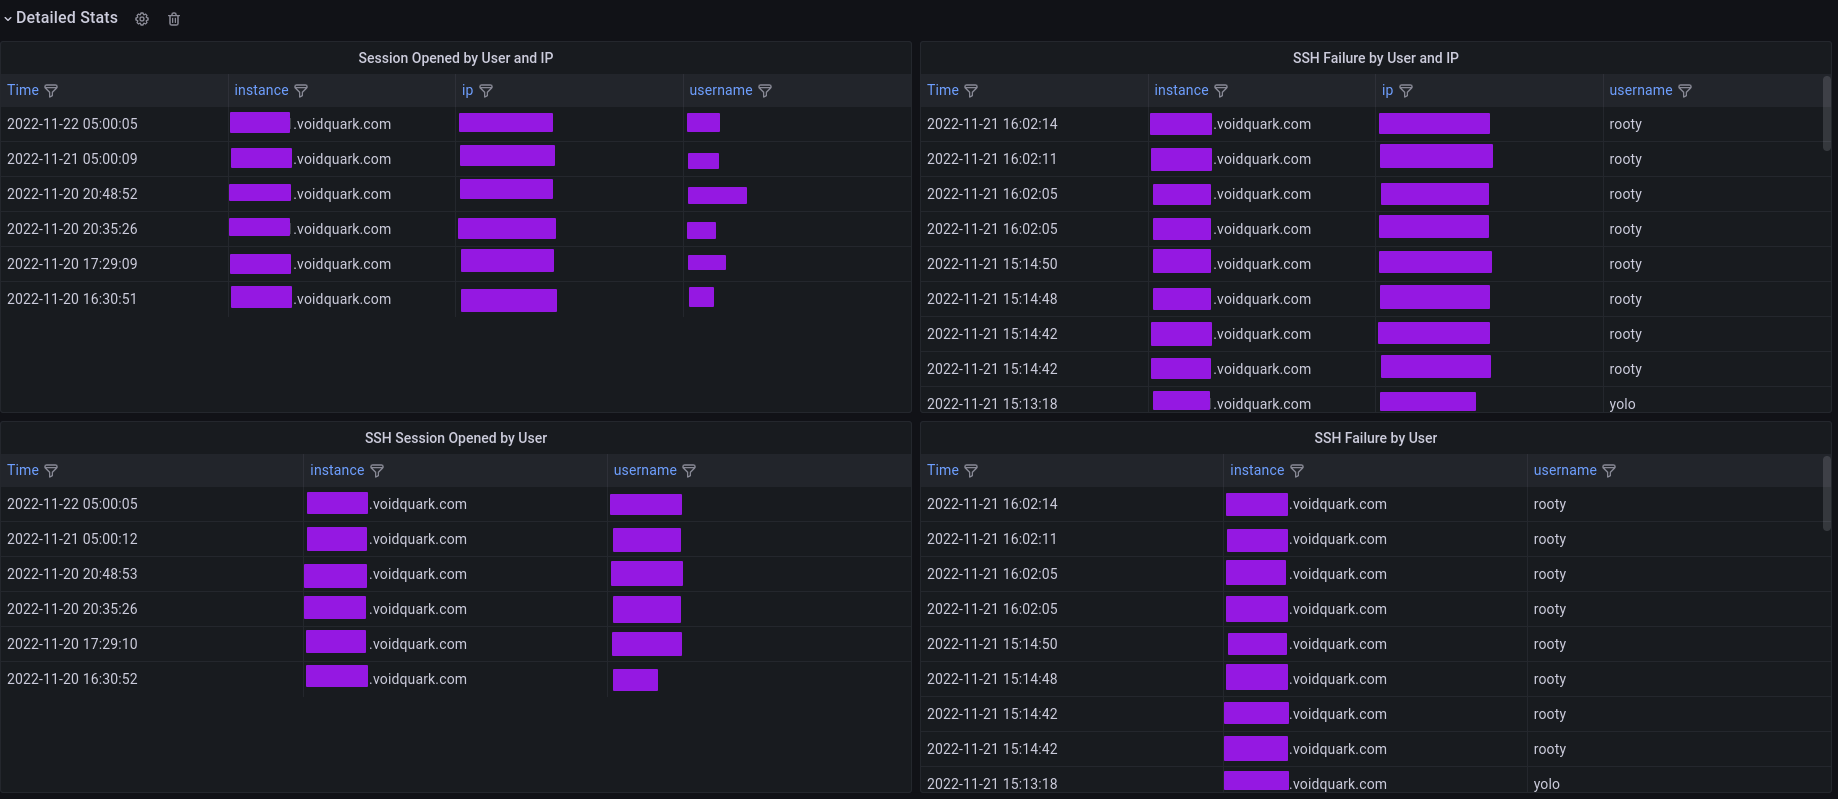
Linux SSH Logs
Visualize Linux SSH opened connection/failed attempt using promtail and loki.
How to use this dashboard with explanation in blog: https://voidquark.com/blog/parsing-ssh-logs-with-grafana-loki ( Promtail config, Query explained, Alertmanager rule ).
Tested on RHEL 8 and RHEL9
Source Code
GitHub repo link: https://github.com/voidquark/grafana-dashboards
Author
Created by VoidQuark
Data source config
Collector type:
Collector plugins:
Collector config:
Revisions
Upload an updated version of an exported dashboard.json file from Grafana
| Revision | Description | Created | |
|---|---|---|---|
| Download |
Grafana Loki (self-hosted)
Easily monitor Grafana Loki (self-hosted), a horizontally scalable, highly available, multi-tenant log aggregation system inspired by Prometheus, with Grafana Cloud's out-of-the-box monitoring solution.
Learn more