
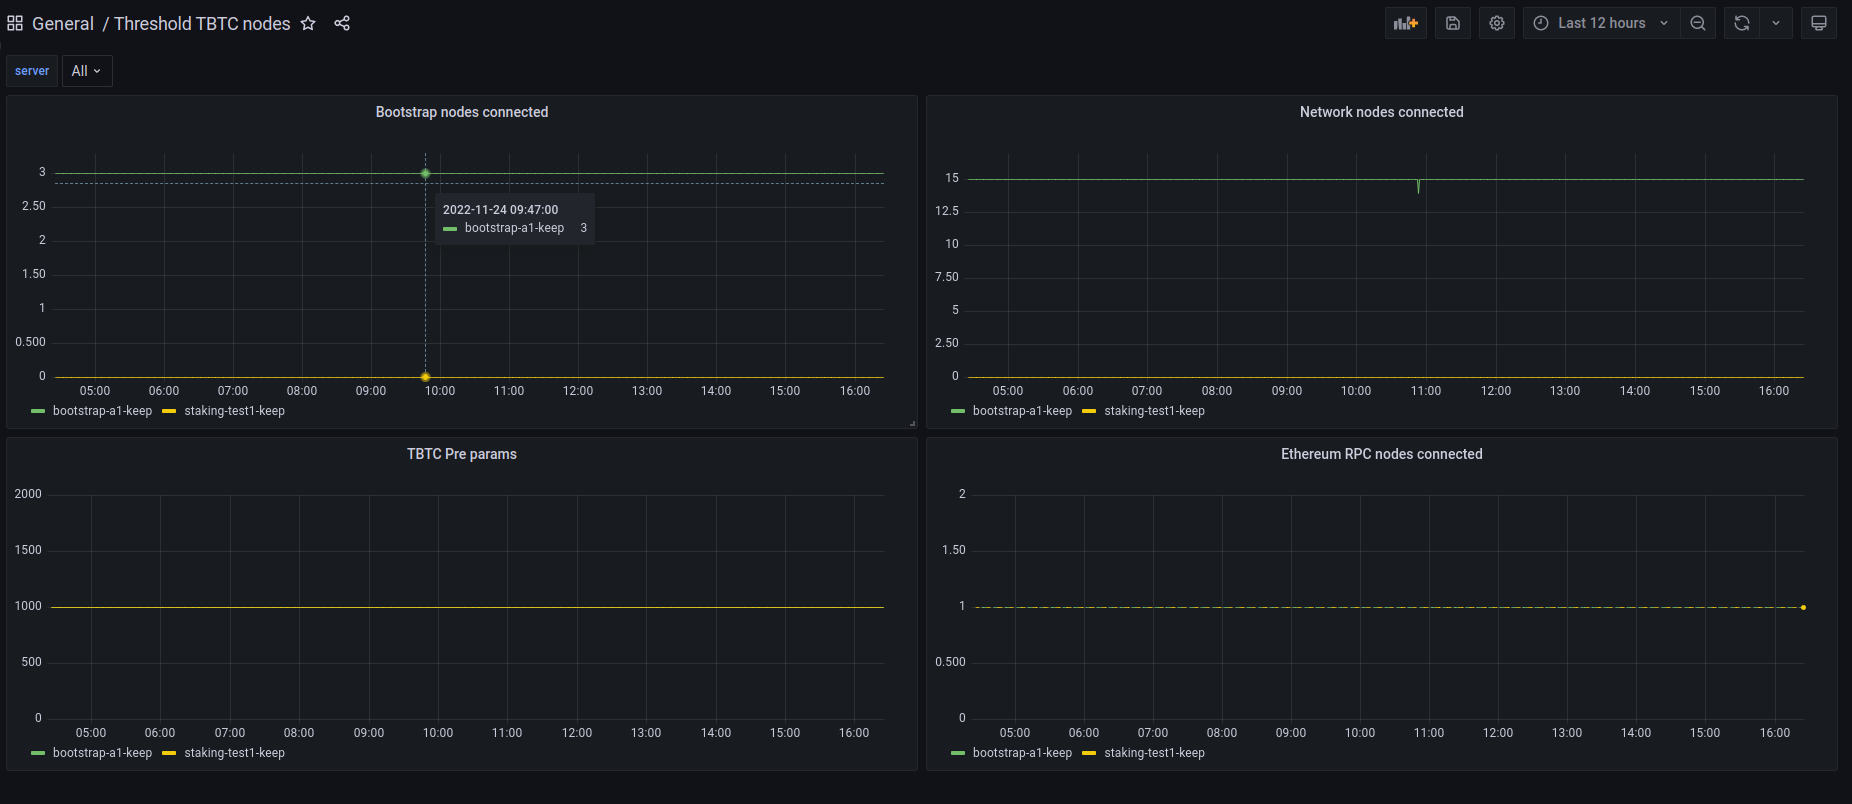
Threshold tBTC nodes
Dashboard for monitoring Threshold Network tBTC nodes
If you define your Prometheus config for tBTC nodes like this:
    - targets:
      - '<your_node_address>:9601'
      labels:
        server: node-a1
Then you should be able to use this dashboard out of the box.
Data source config
Collector type:
Collector plugins:
Collector config:
Revisions
Upload an updated version of an exported dashboard.json file from Grafana
| Revision | Description | Created | |
|---|---|---|---|
| Download |