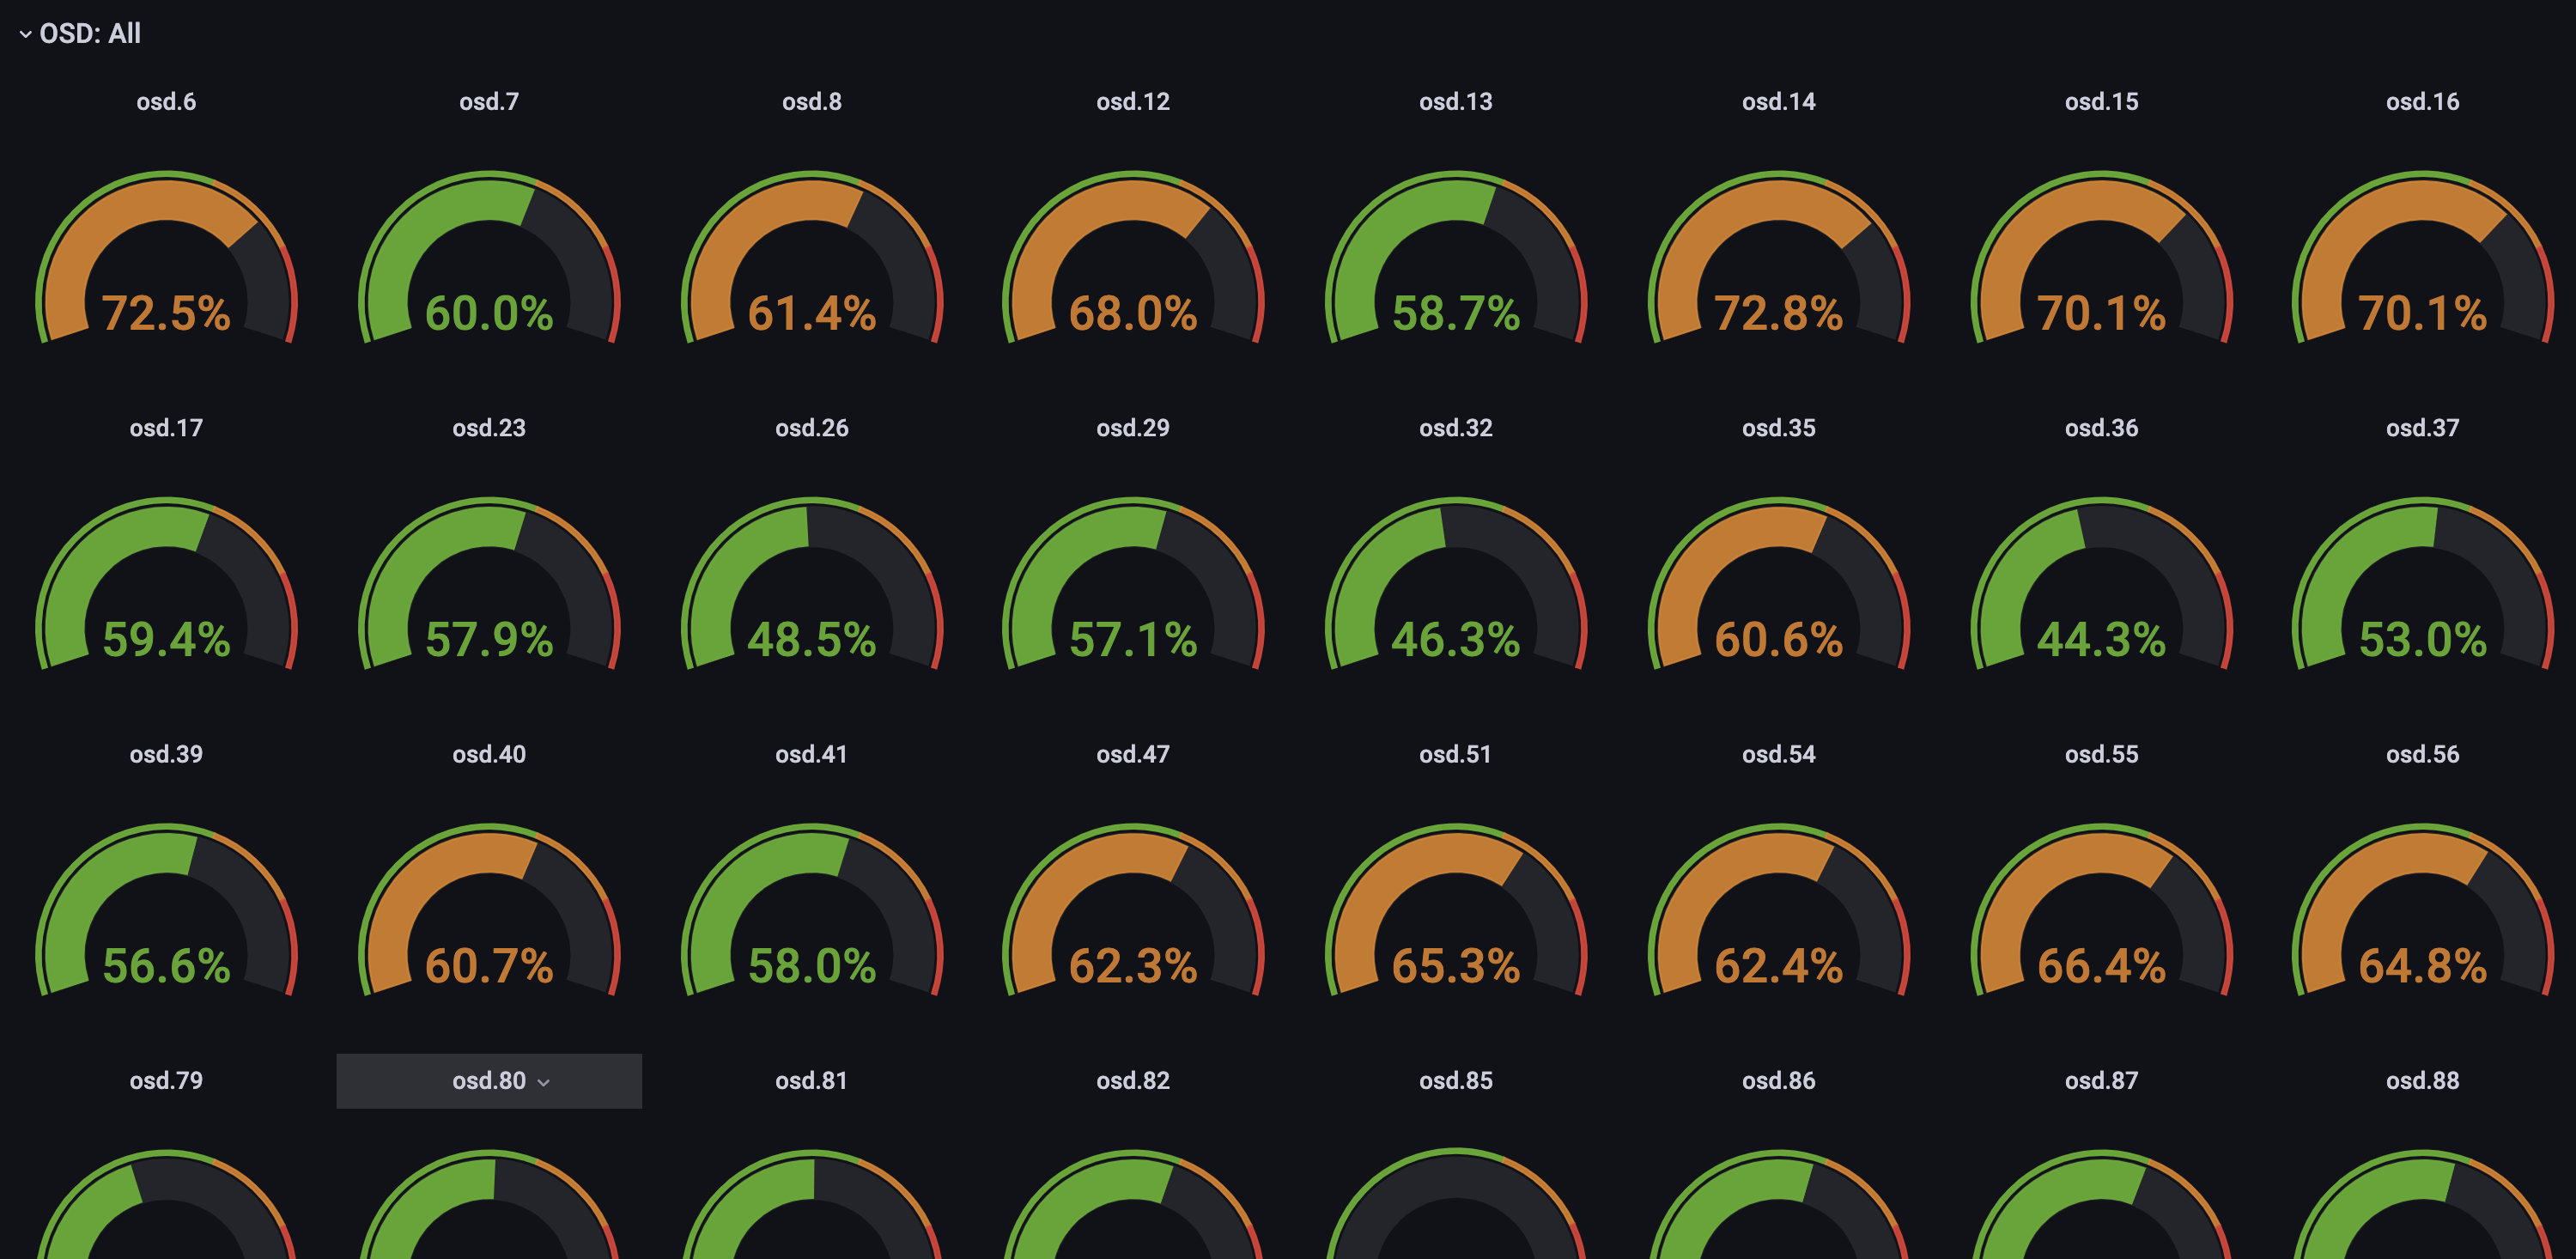
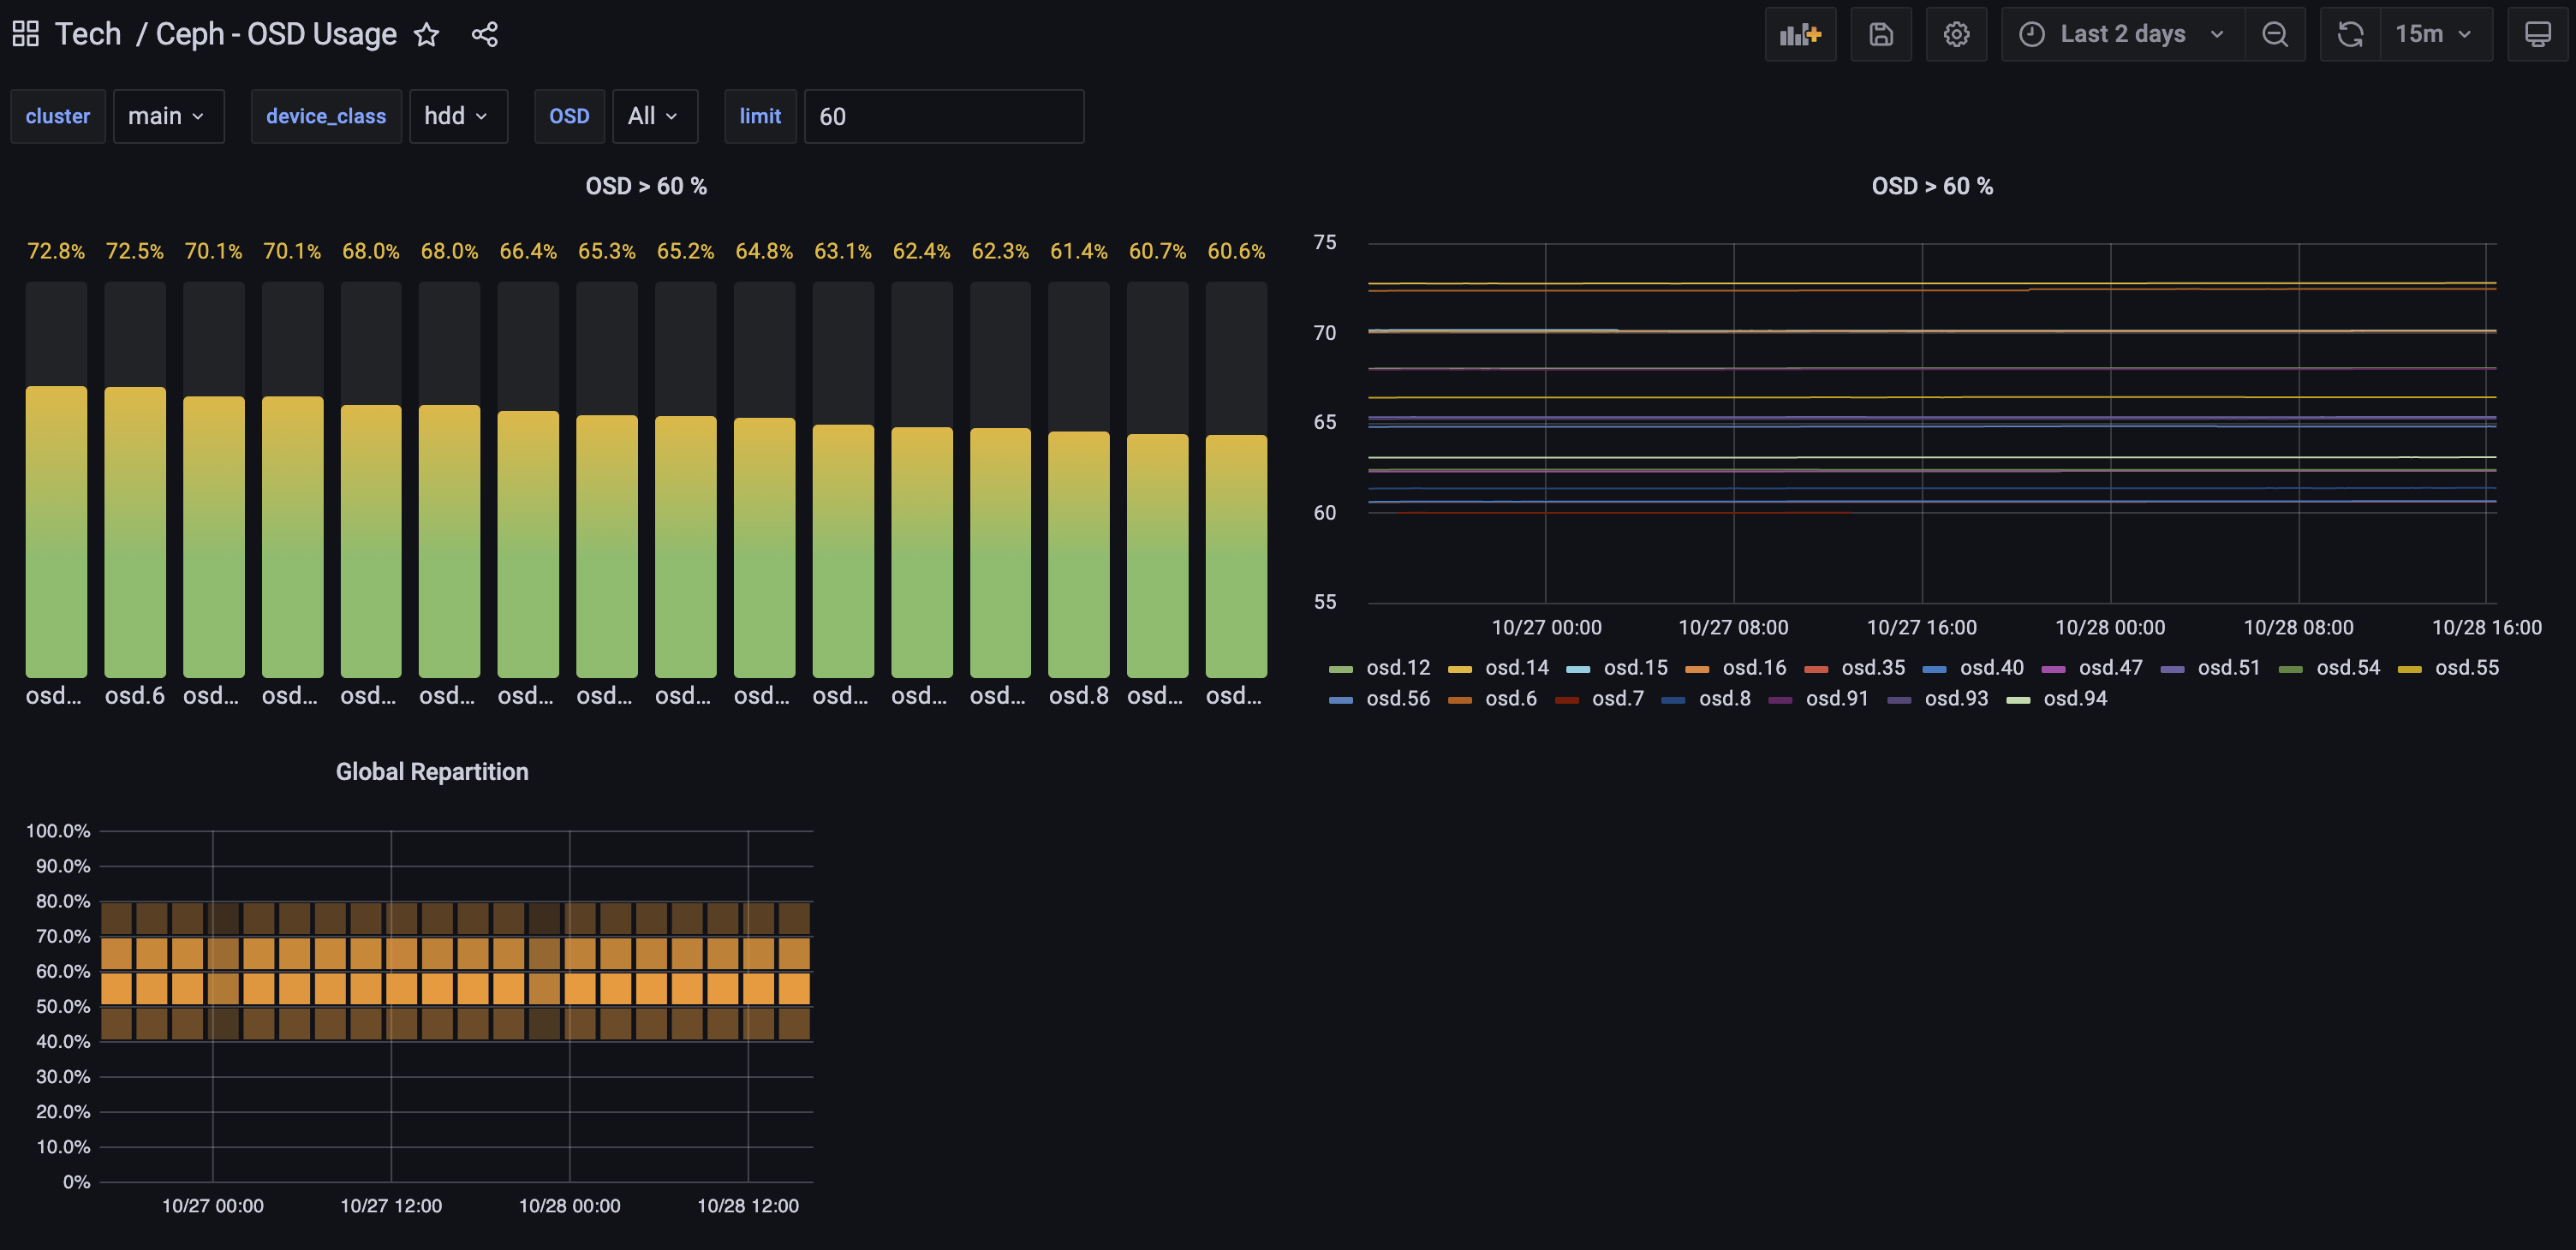
Ceph - OSD Usage
Ceph OSD Usage per device_class
Simple dashboard to view OSD usage. For multiple clusters, requires a label with the cluster name in the prometheus target : "cluster":"mycluster"
Data source config
Collector config:
Upload an updated version of an exported dashboard.json file from Grafana
| Revision | Description | Created | |
|---|---|---|---|
| Download |
Ceph
Monitor Ceph with Grafana. Easily keep tabs on your cluster with Grafana Cloud's out-of-the-box monitoring solution.
Learn more

