
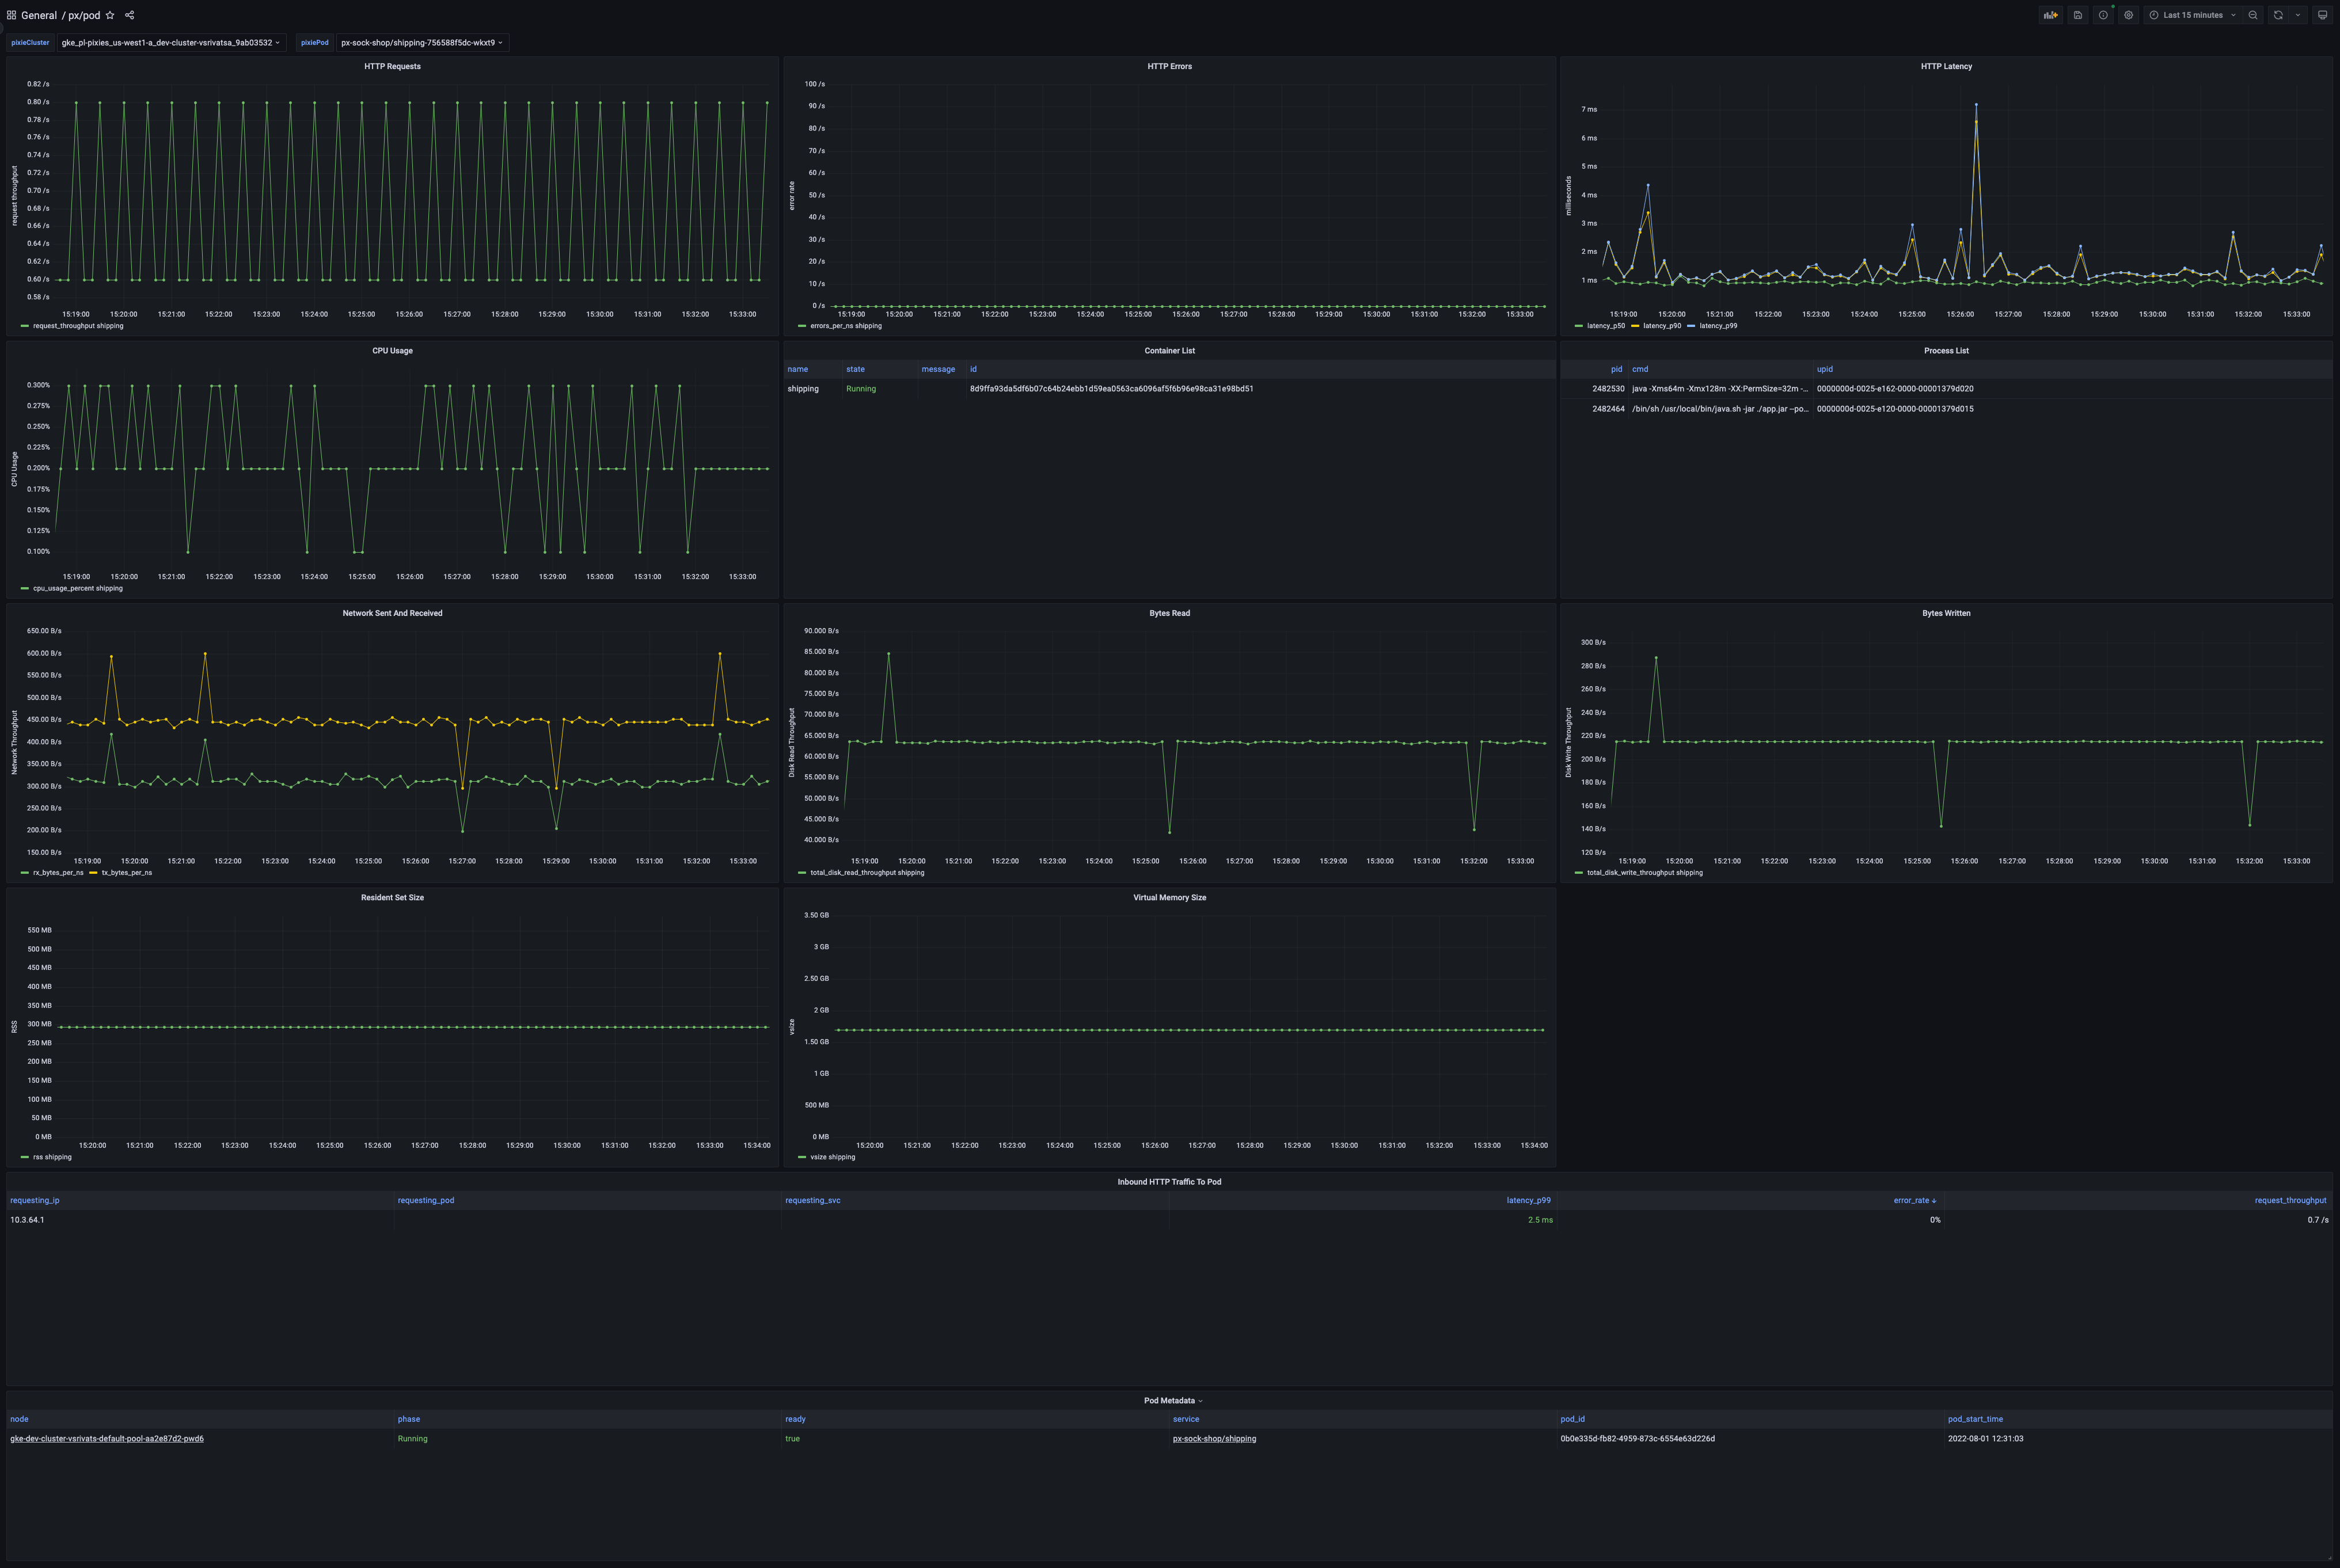
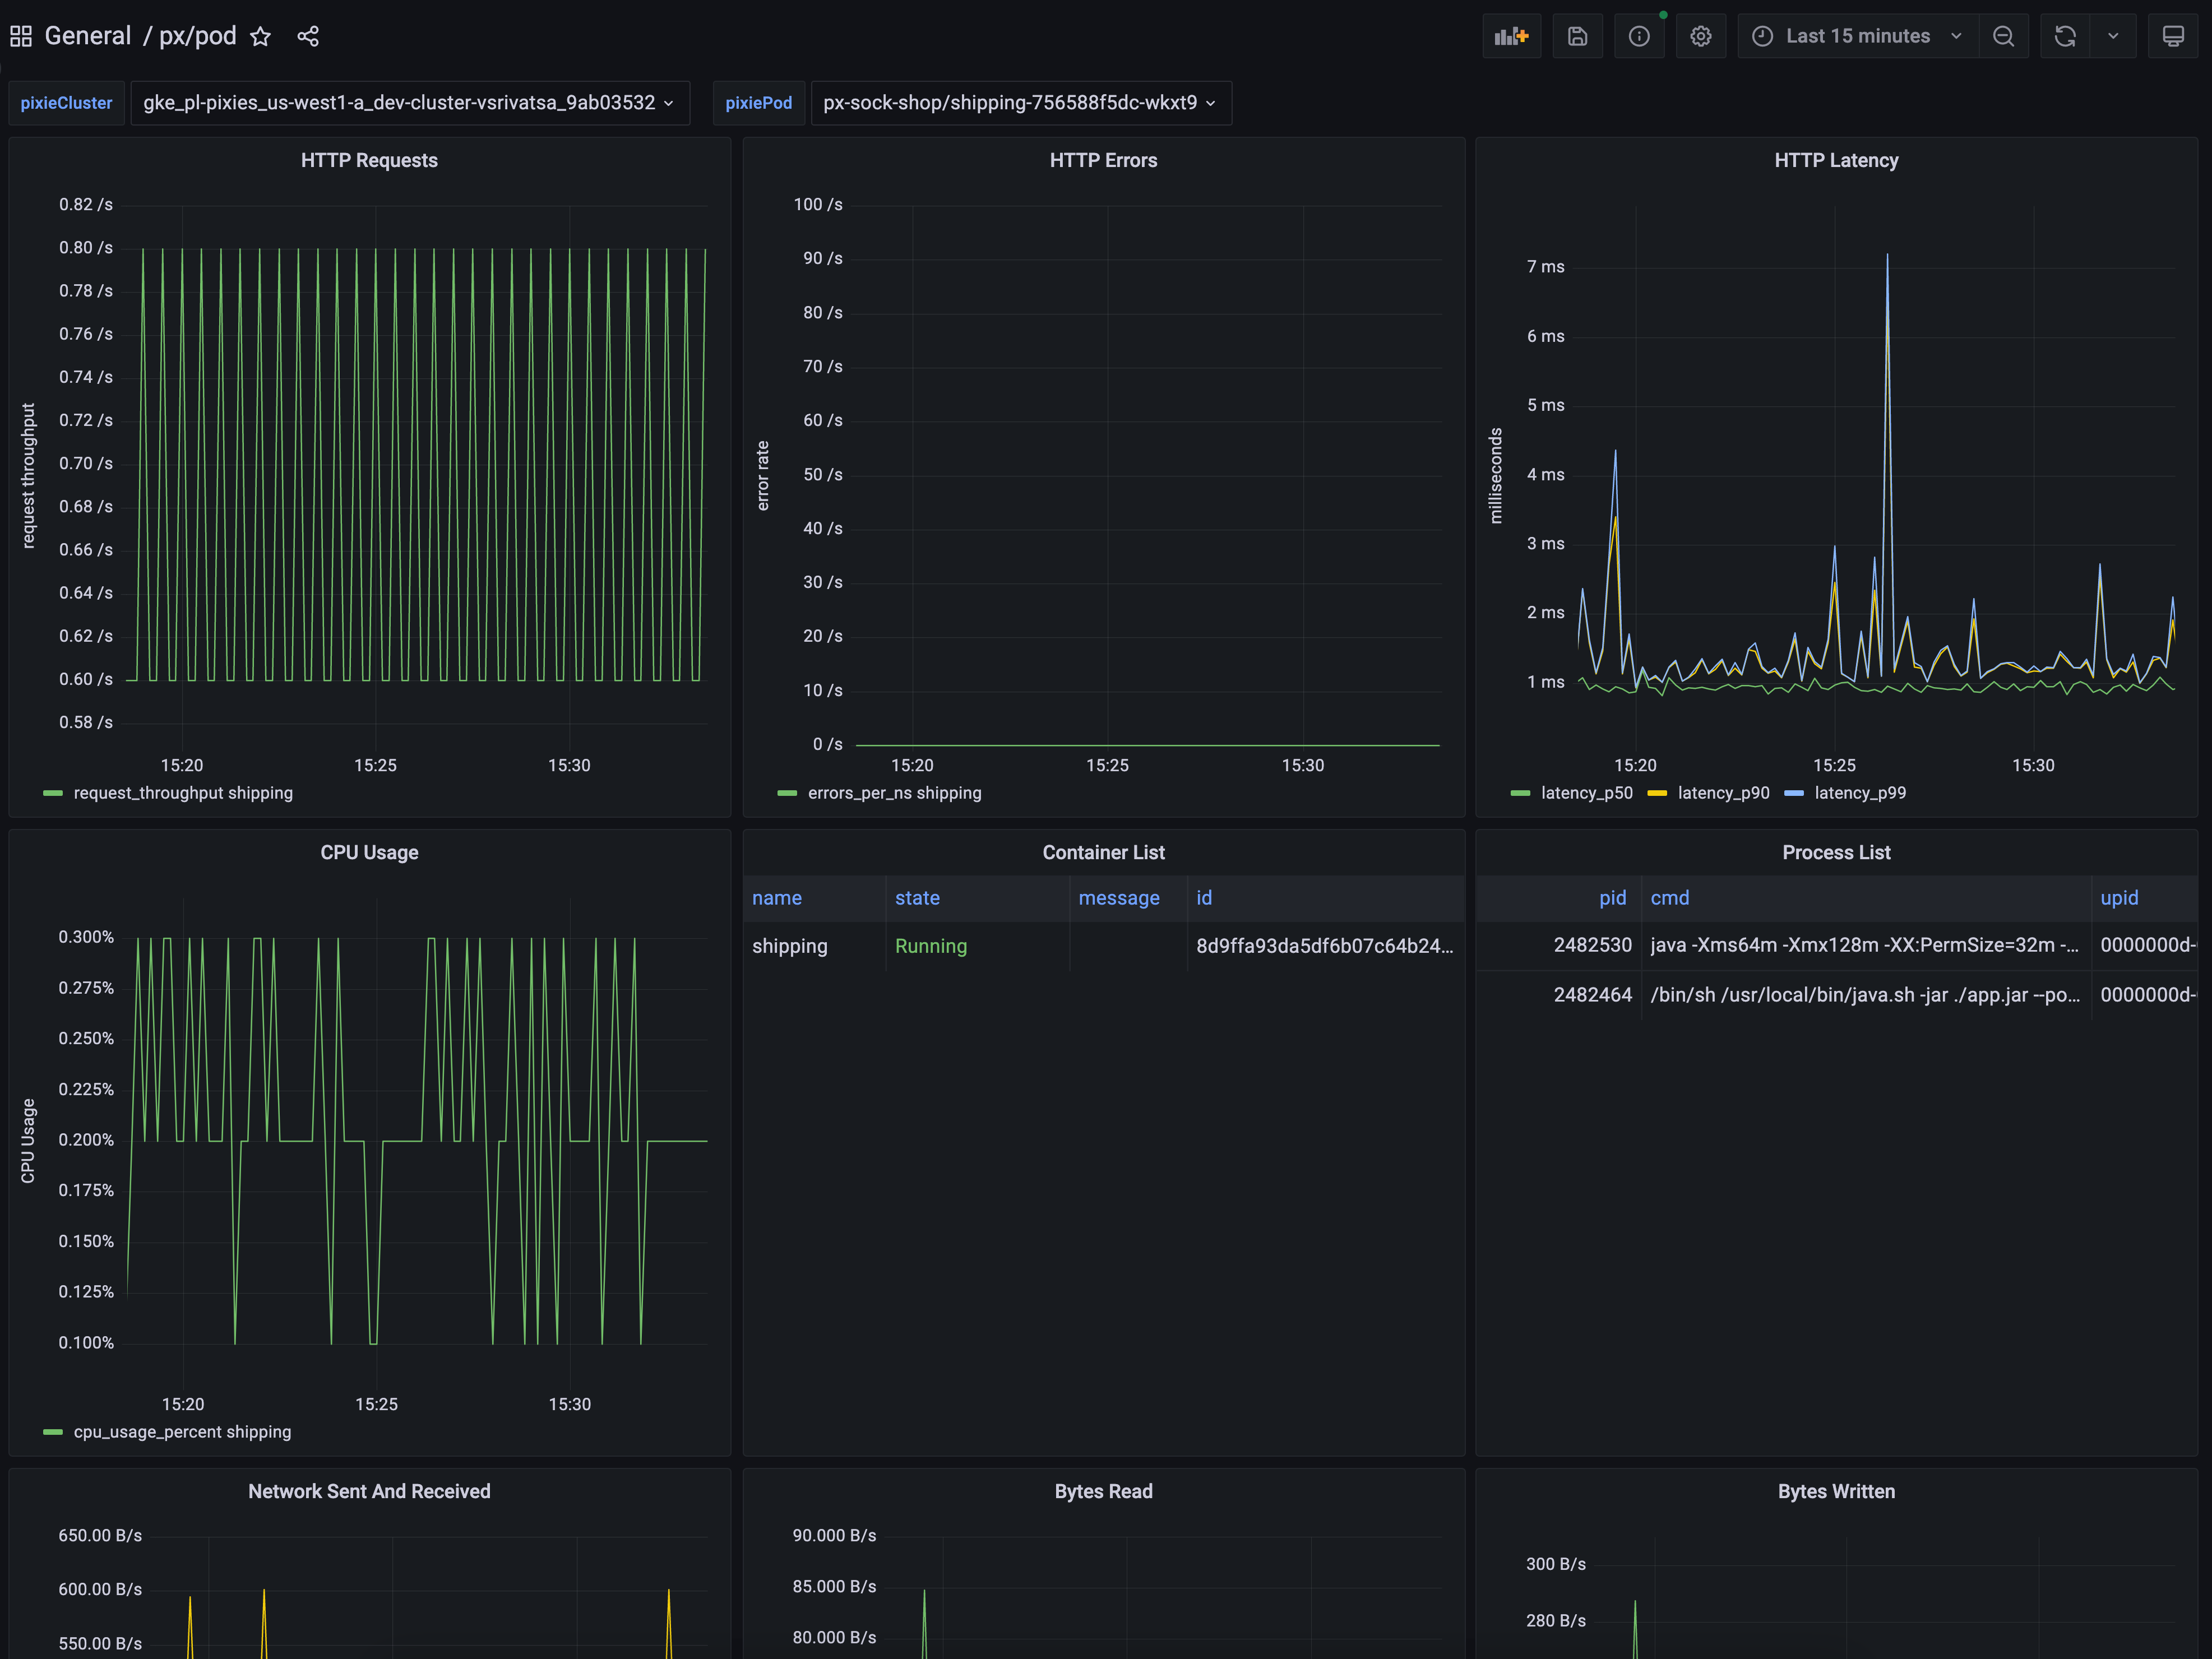
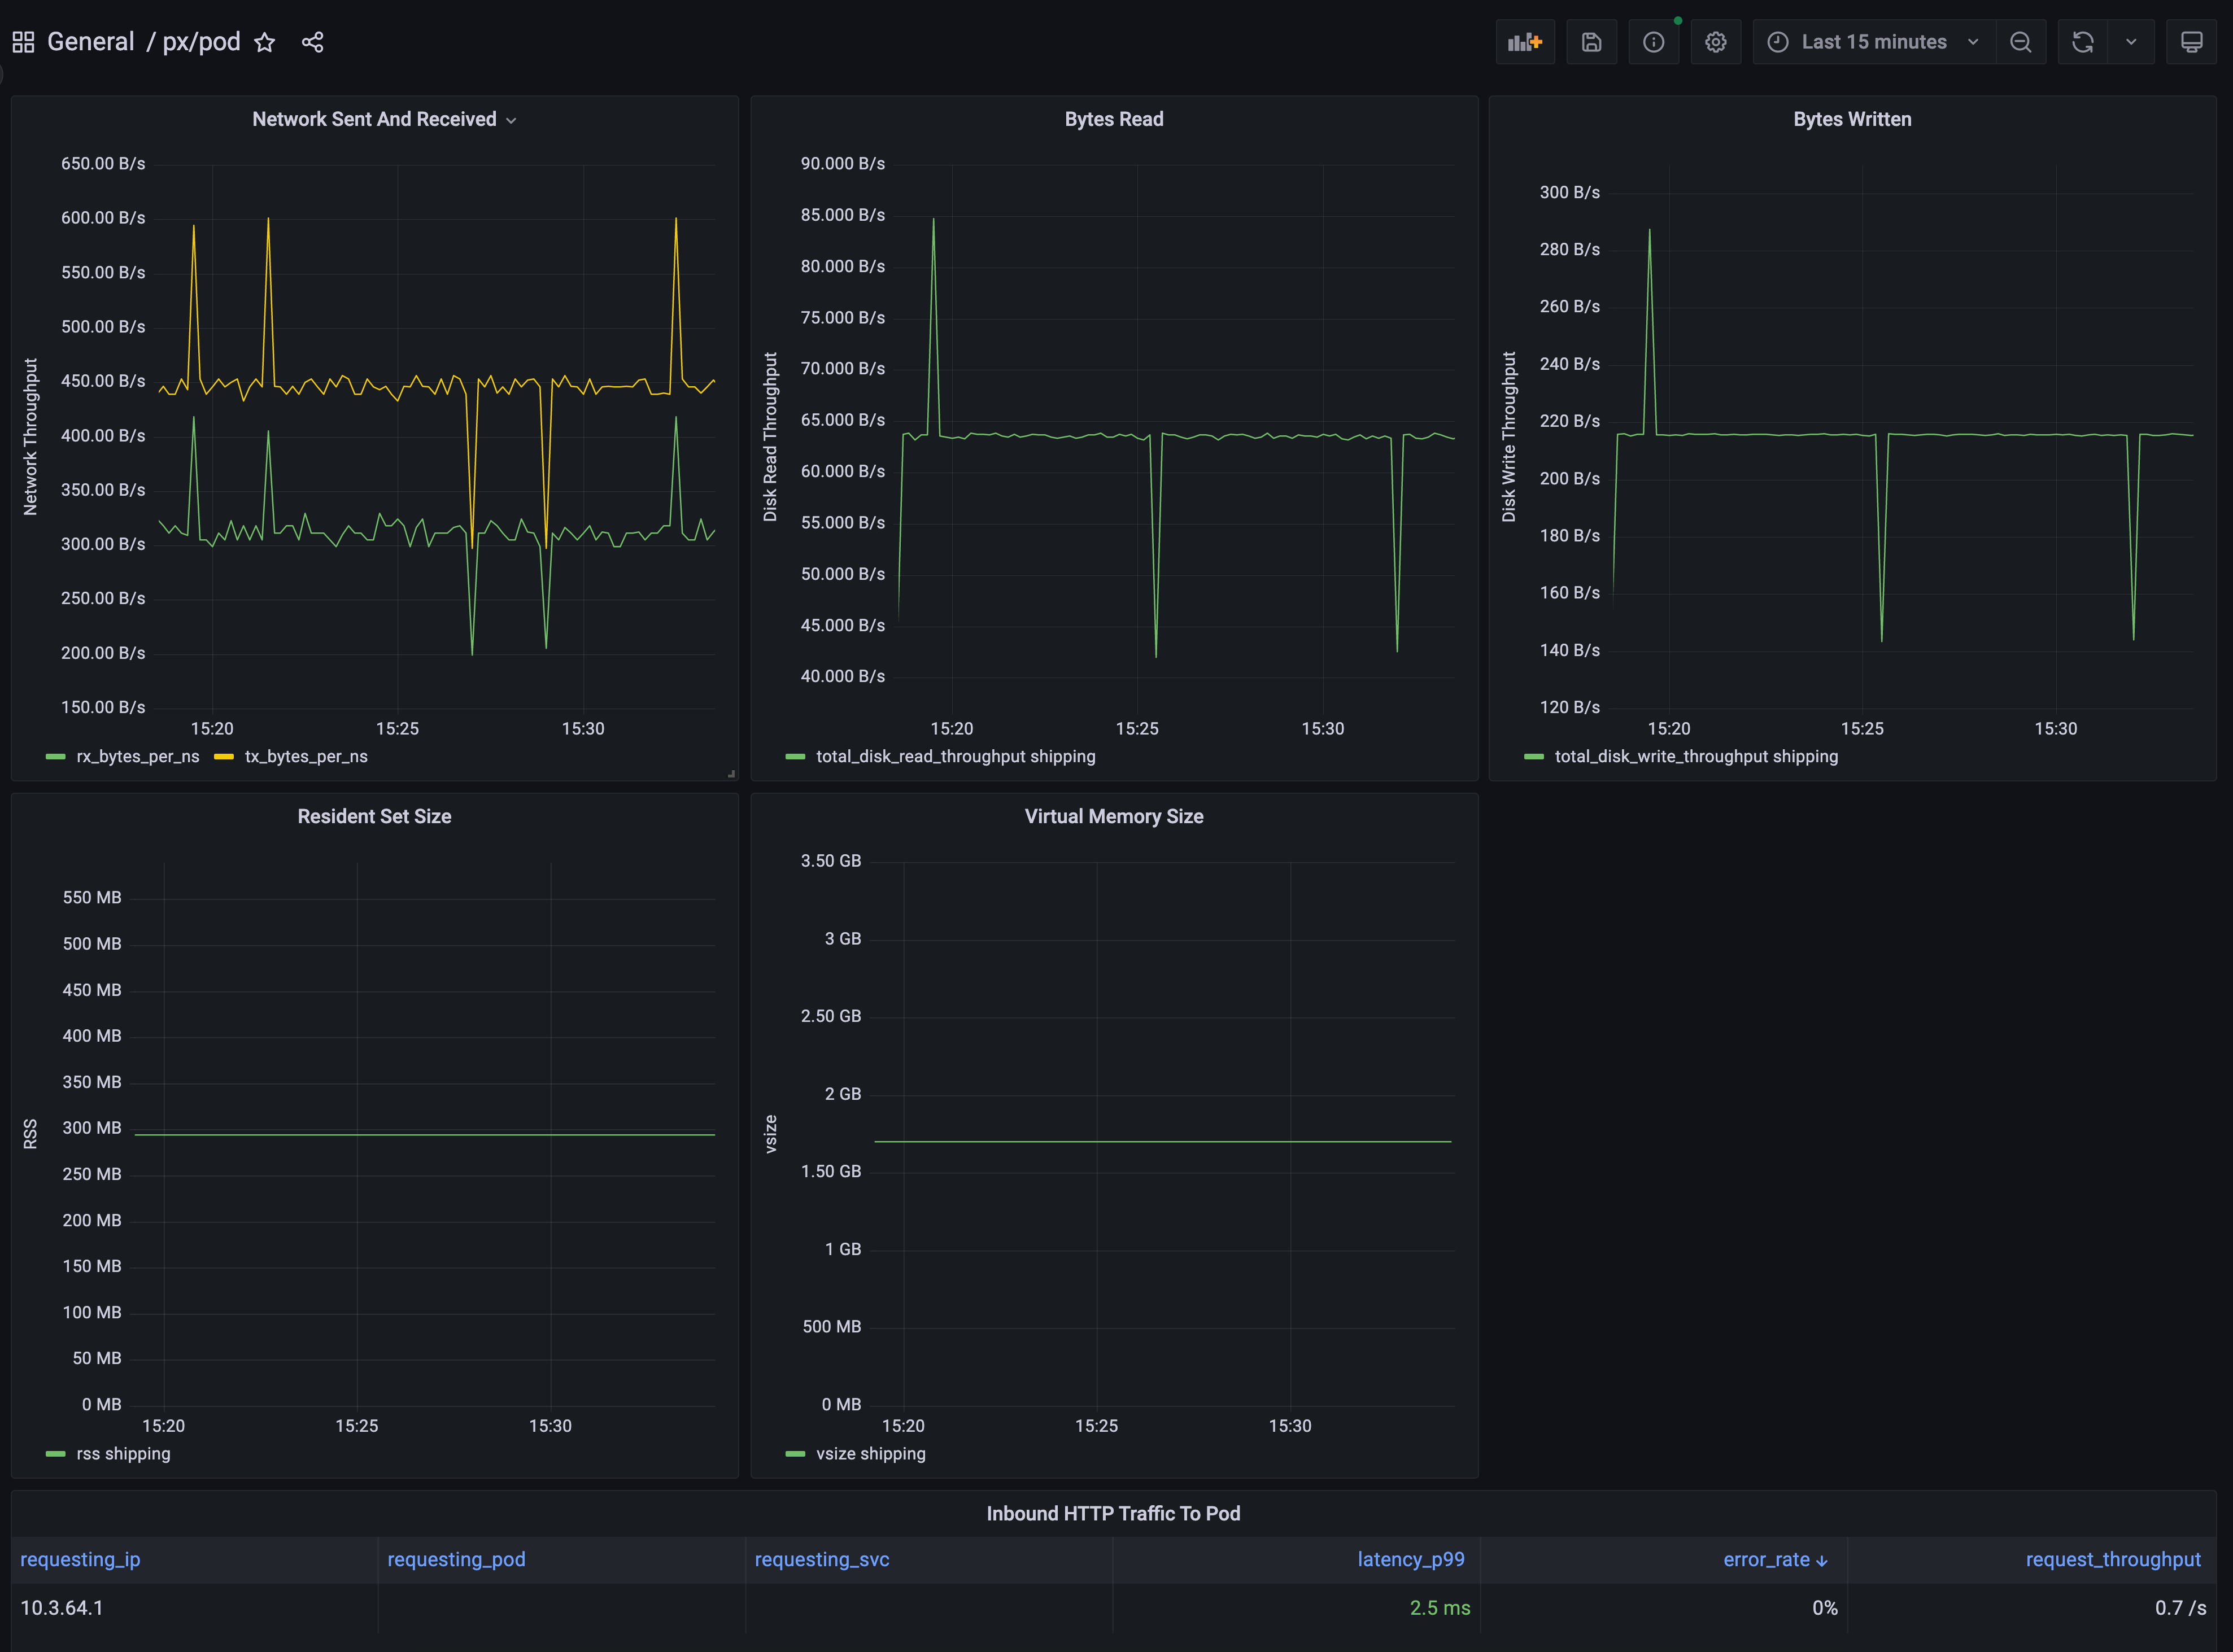
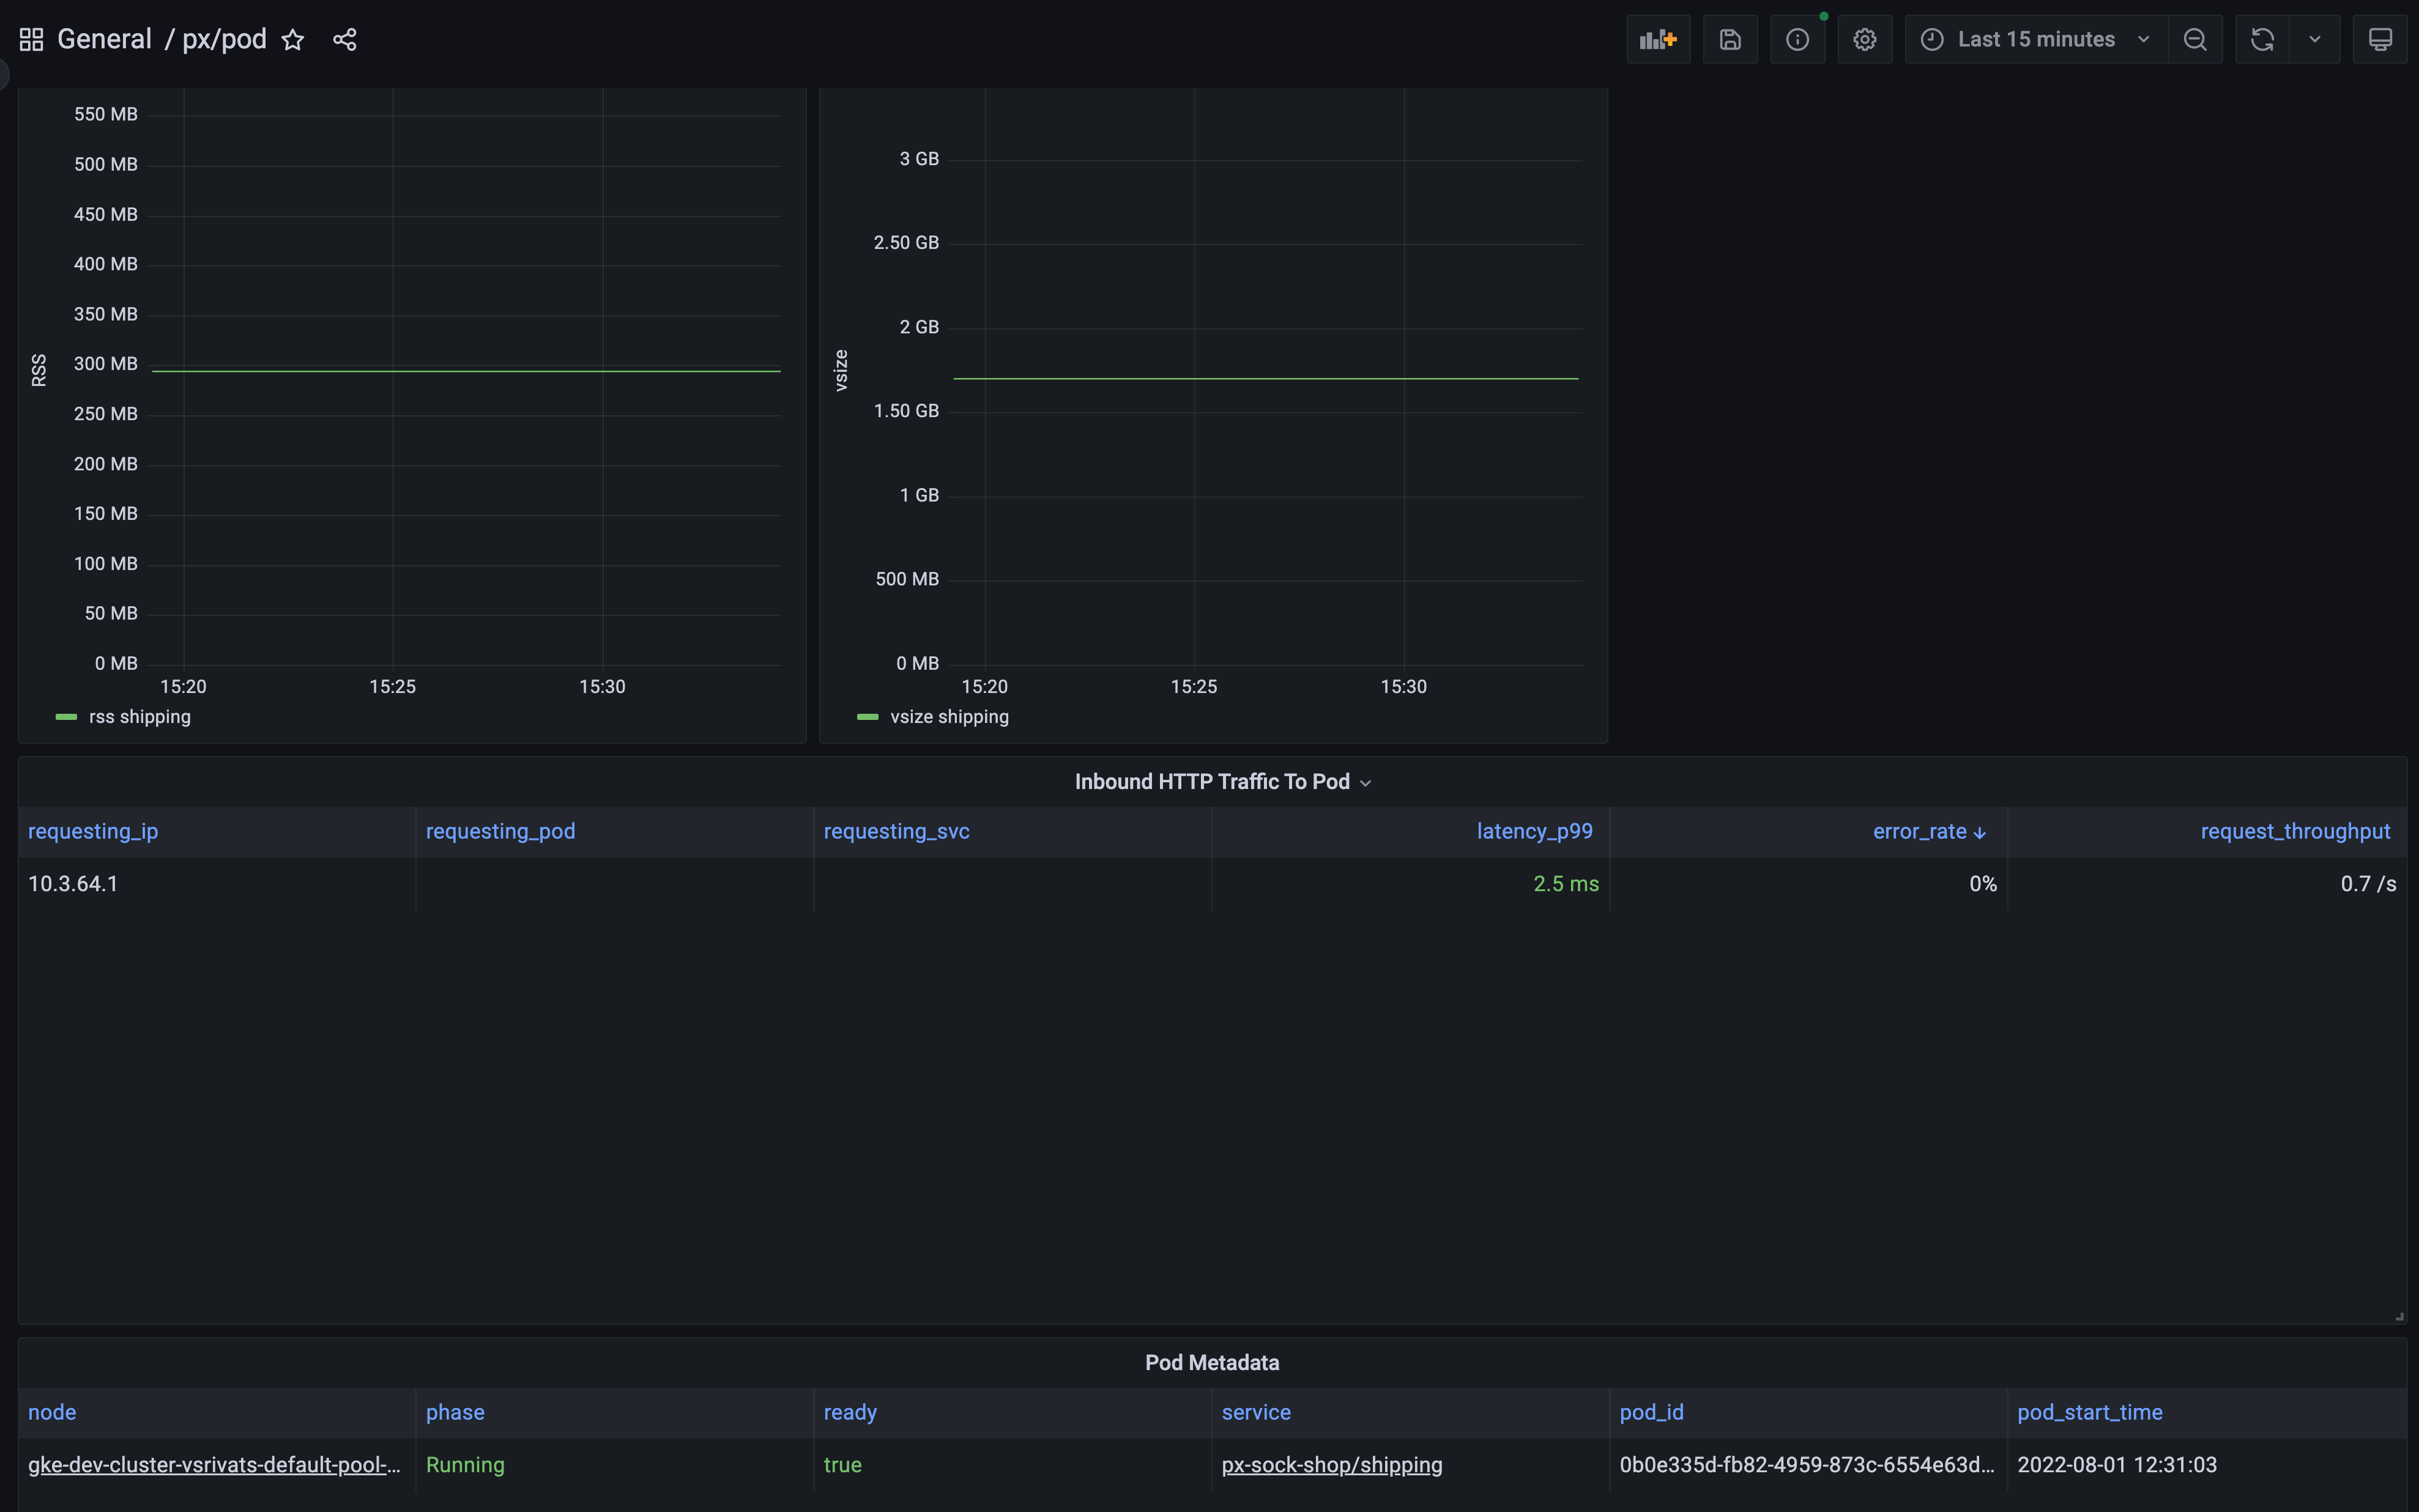
Pixie Pod Overview
Dashboard shows an overview of the specified pod, including high-level HTTP application metrics, and resource usage.
To learn how to monitor infrastructure health using Pixie, see the tutorial.
Data source config
Collector type:
Collector plugins:
Collector config:
Revisions
Upload an updated version of an exported dashboard.json file from Grafana
| Revision | Description | Created | |
|---|---|---|---|
| Download |