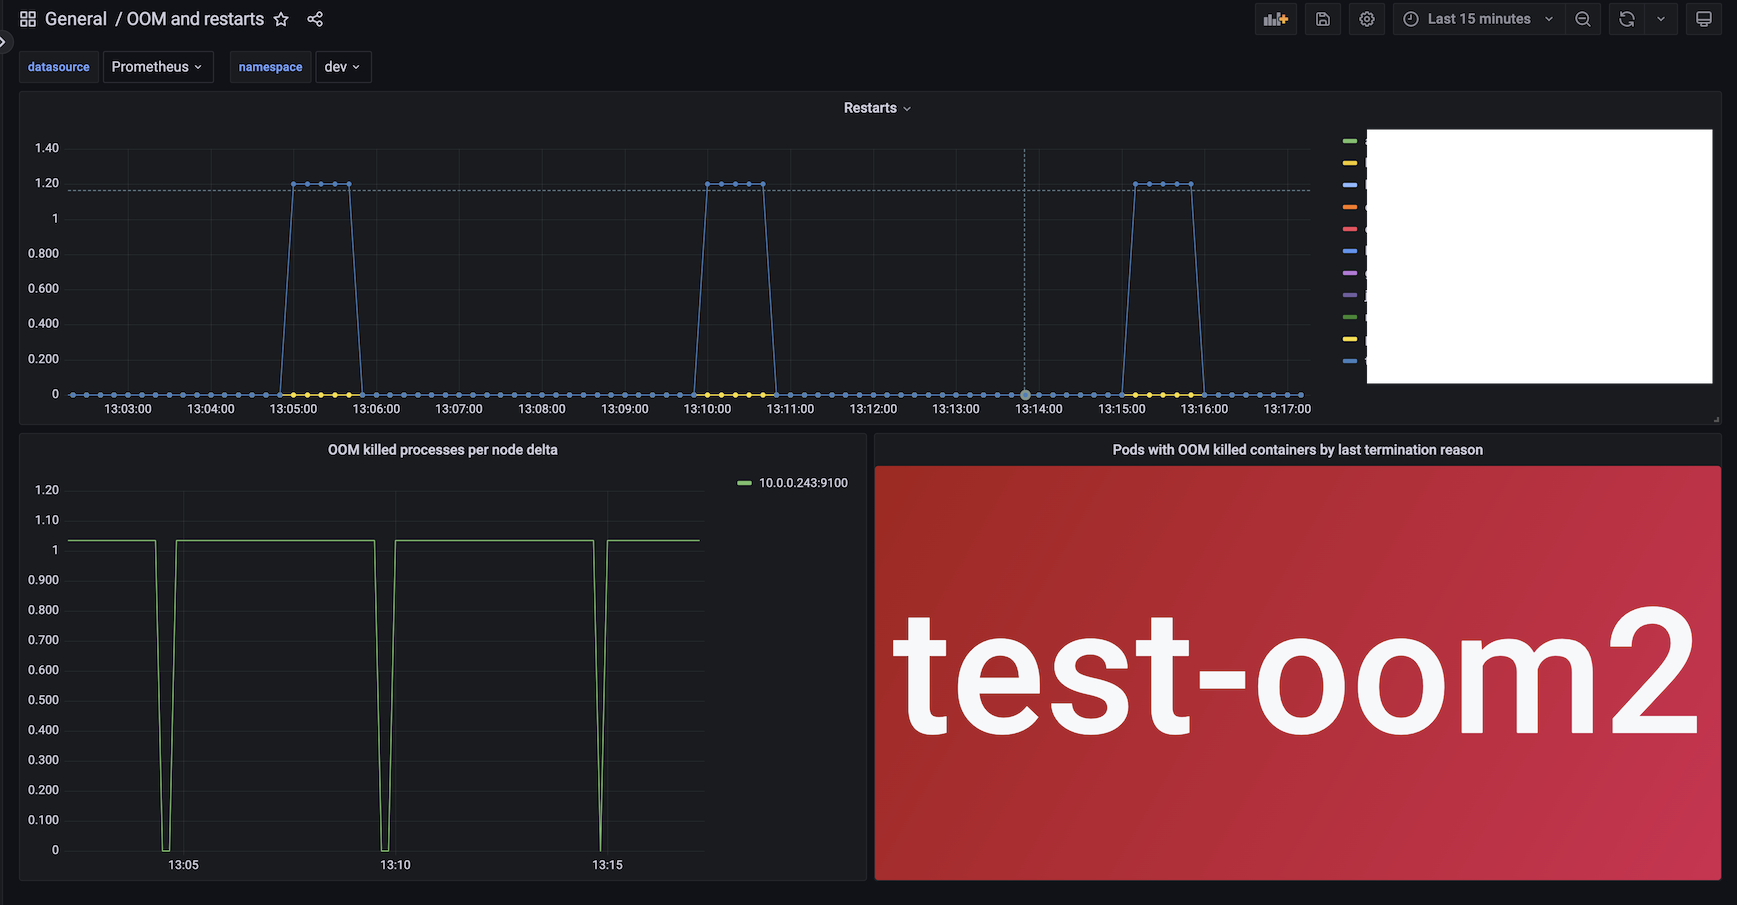
OOM and restarts
Contains panels that show: 1. restarts per pod 2. oom killed processes in the node 3. pods that got oom killed
Data source config
Collector config:
Upload an updated version of an exported dashboard.json file from Grafana
| Revision | Description | Created | |
|---|---|---|---|
| Download |

