
Azure / Container Apps / Container App View
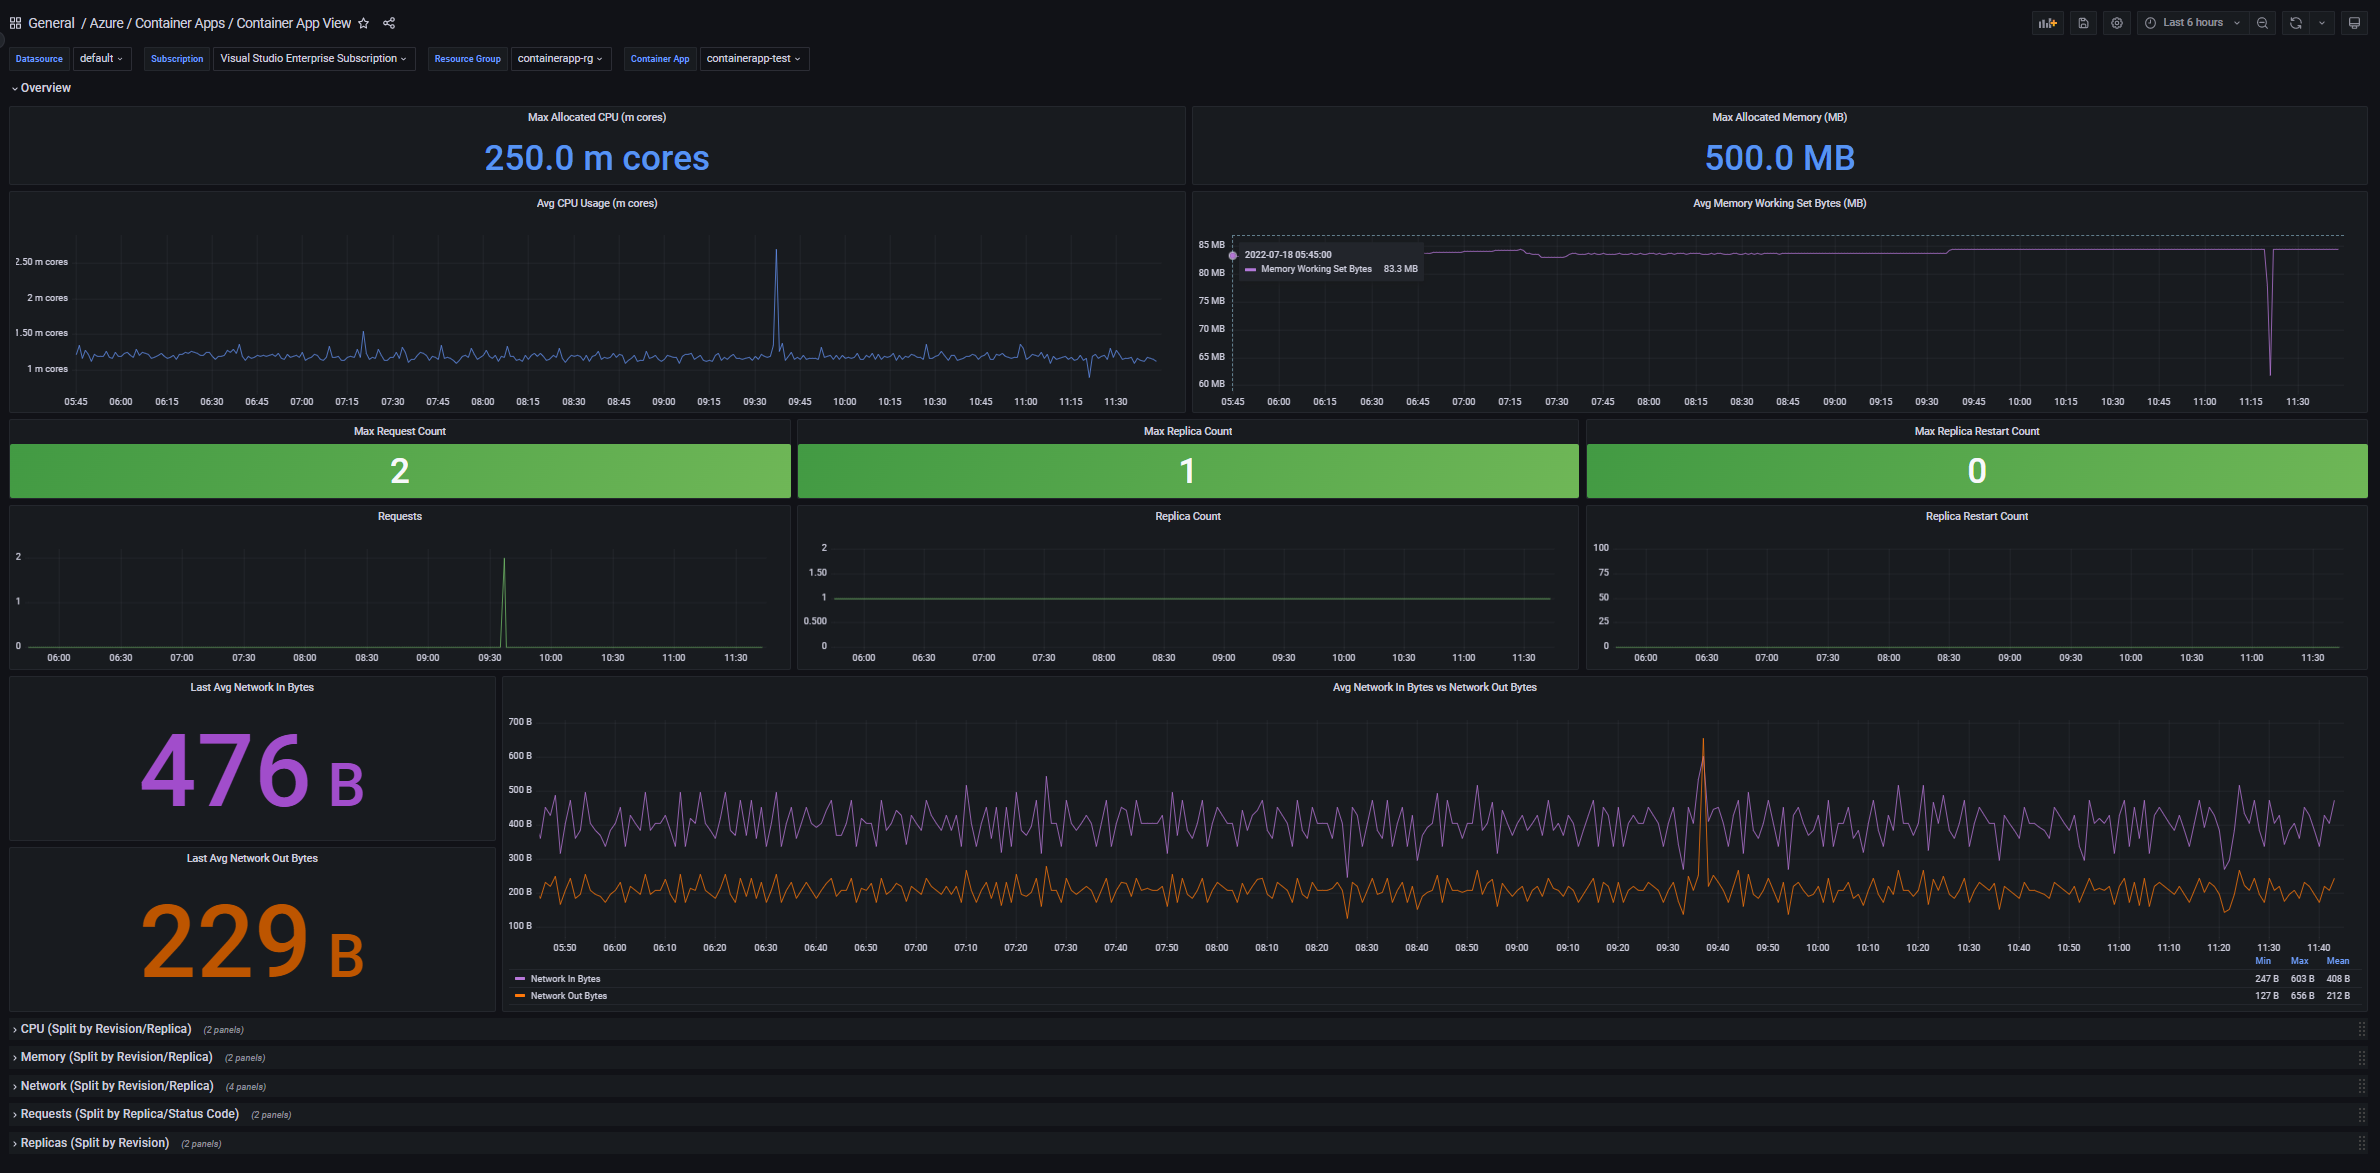
This is one of two dashboards built for Azure Container Apps. This dashboard is app-based, displaying seven key metrics for a container app using Azure Monitor metrics and Azure Resource Graph. These are: CPU, memory, requests, replica count, replica restart count, network in bytes, and network out bytes. The dashboard also has additional rows for metrics by dimension (e.g. viewing requests by status code).
Created by: Vikram Bala (t-vikrambala@microsoft.com)
Data source config
Collector type:
Collector plugins:
Collector config:
Revisions
Upload an updated version of an exported dashboard.json file from Grafana
| Revision | Description | Created | |
|---|---|---|---|
| Download |
Azure Cosmos DB
With the Grafana plugin for Azure Cosmos DB, you can quickly visualize and query your Azure Cosmos DB data from within Grafana.
Learn more