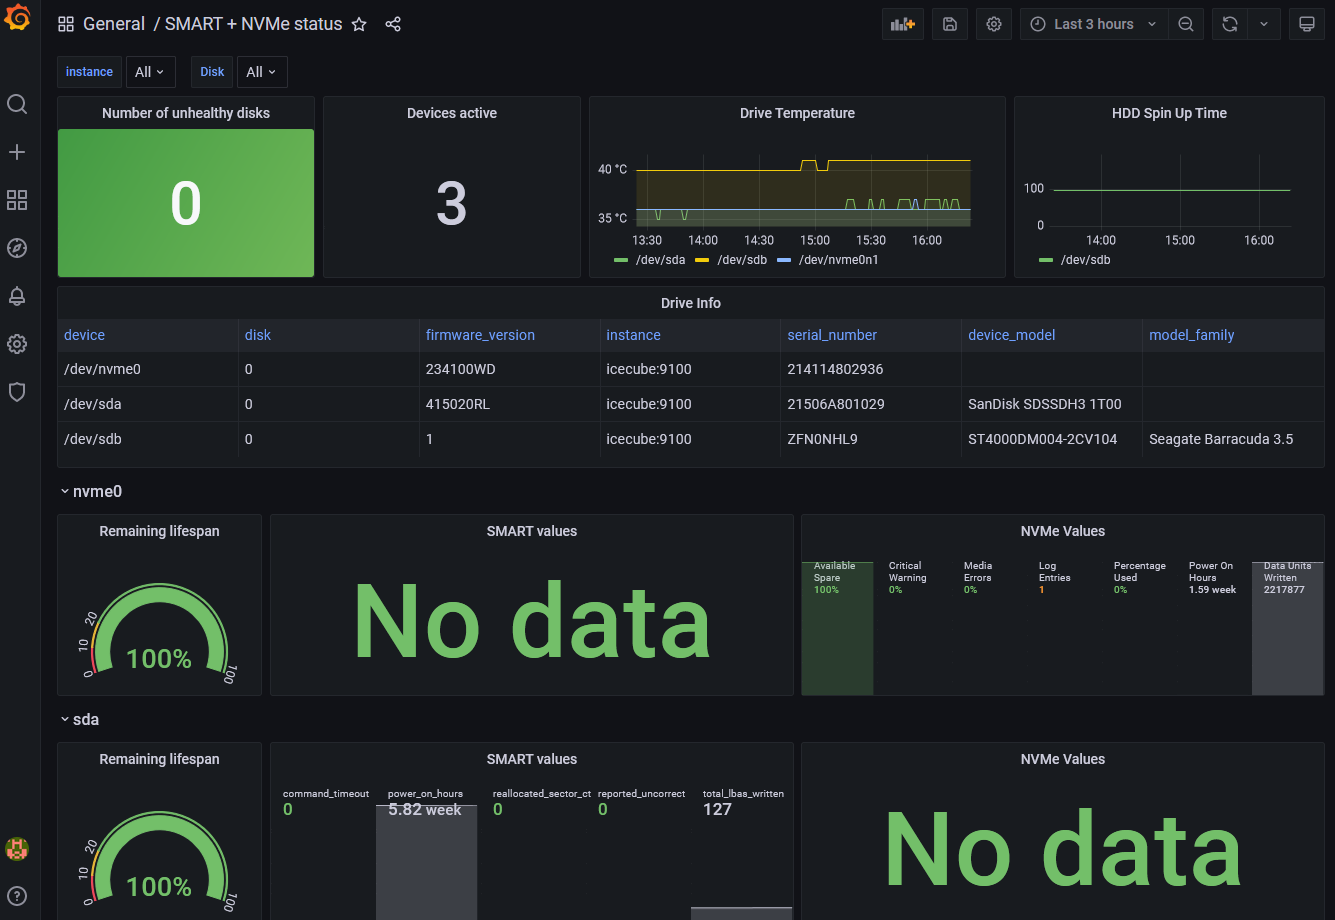
SMART + NVMe status
Combined metrics for the S.M.A.R.T. and NVMe status of SATA HDD, SATA SSD, and NVMe SSD drives via Prometheus and Node_exporter
View the important metrics for S.M.A.R.T. and NVMe storage devices (Both HDD and SSD) from the standard node-exporter textfile collectors in a unified view.
I've got a blog article explaining how to use this dashboard, alongside the node_exporter and Prometheus, to monitor the state of a mixed fleet of hard drives.
Data source config
Collector config:
Upload an updated version of an exported dashboard.json file from Grafana
| Revision | Description | Created | |
|---|---|---|---|
| Download |

