
Opstree/Elasticsearch SRE
Display Elasticsearch metrics for SRE
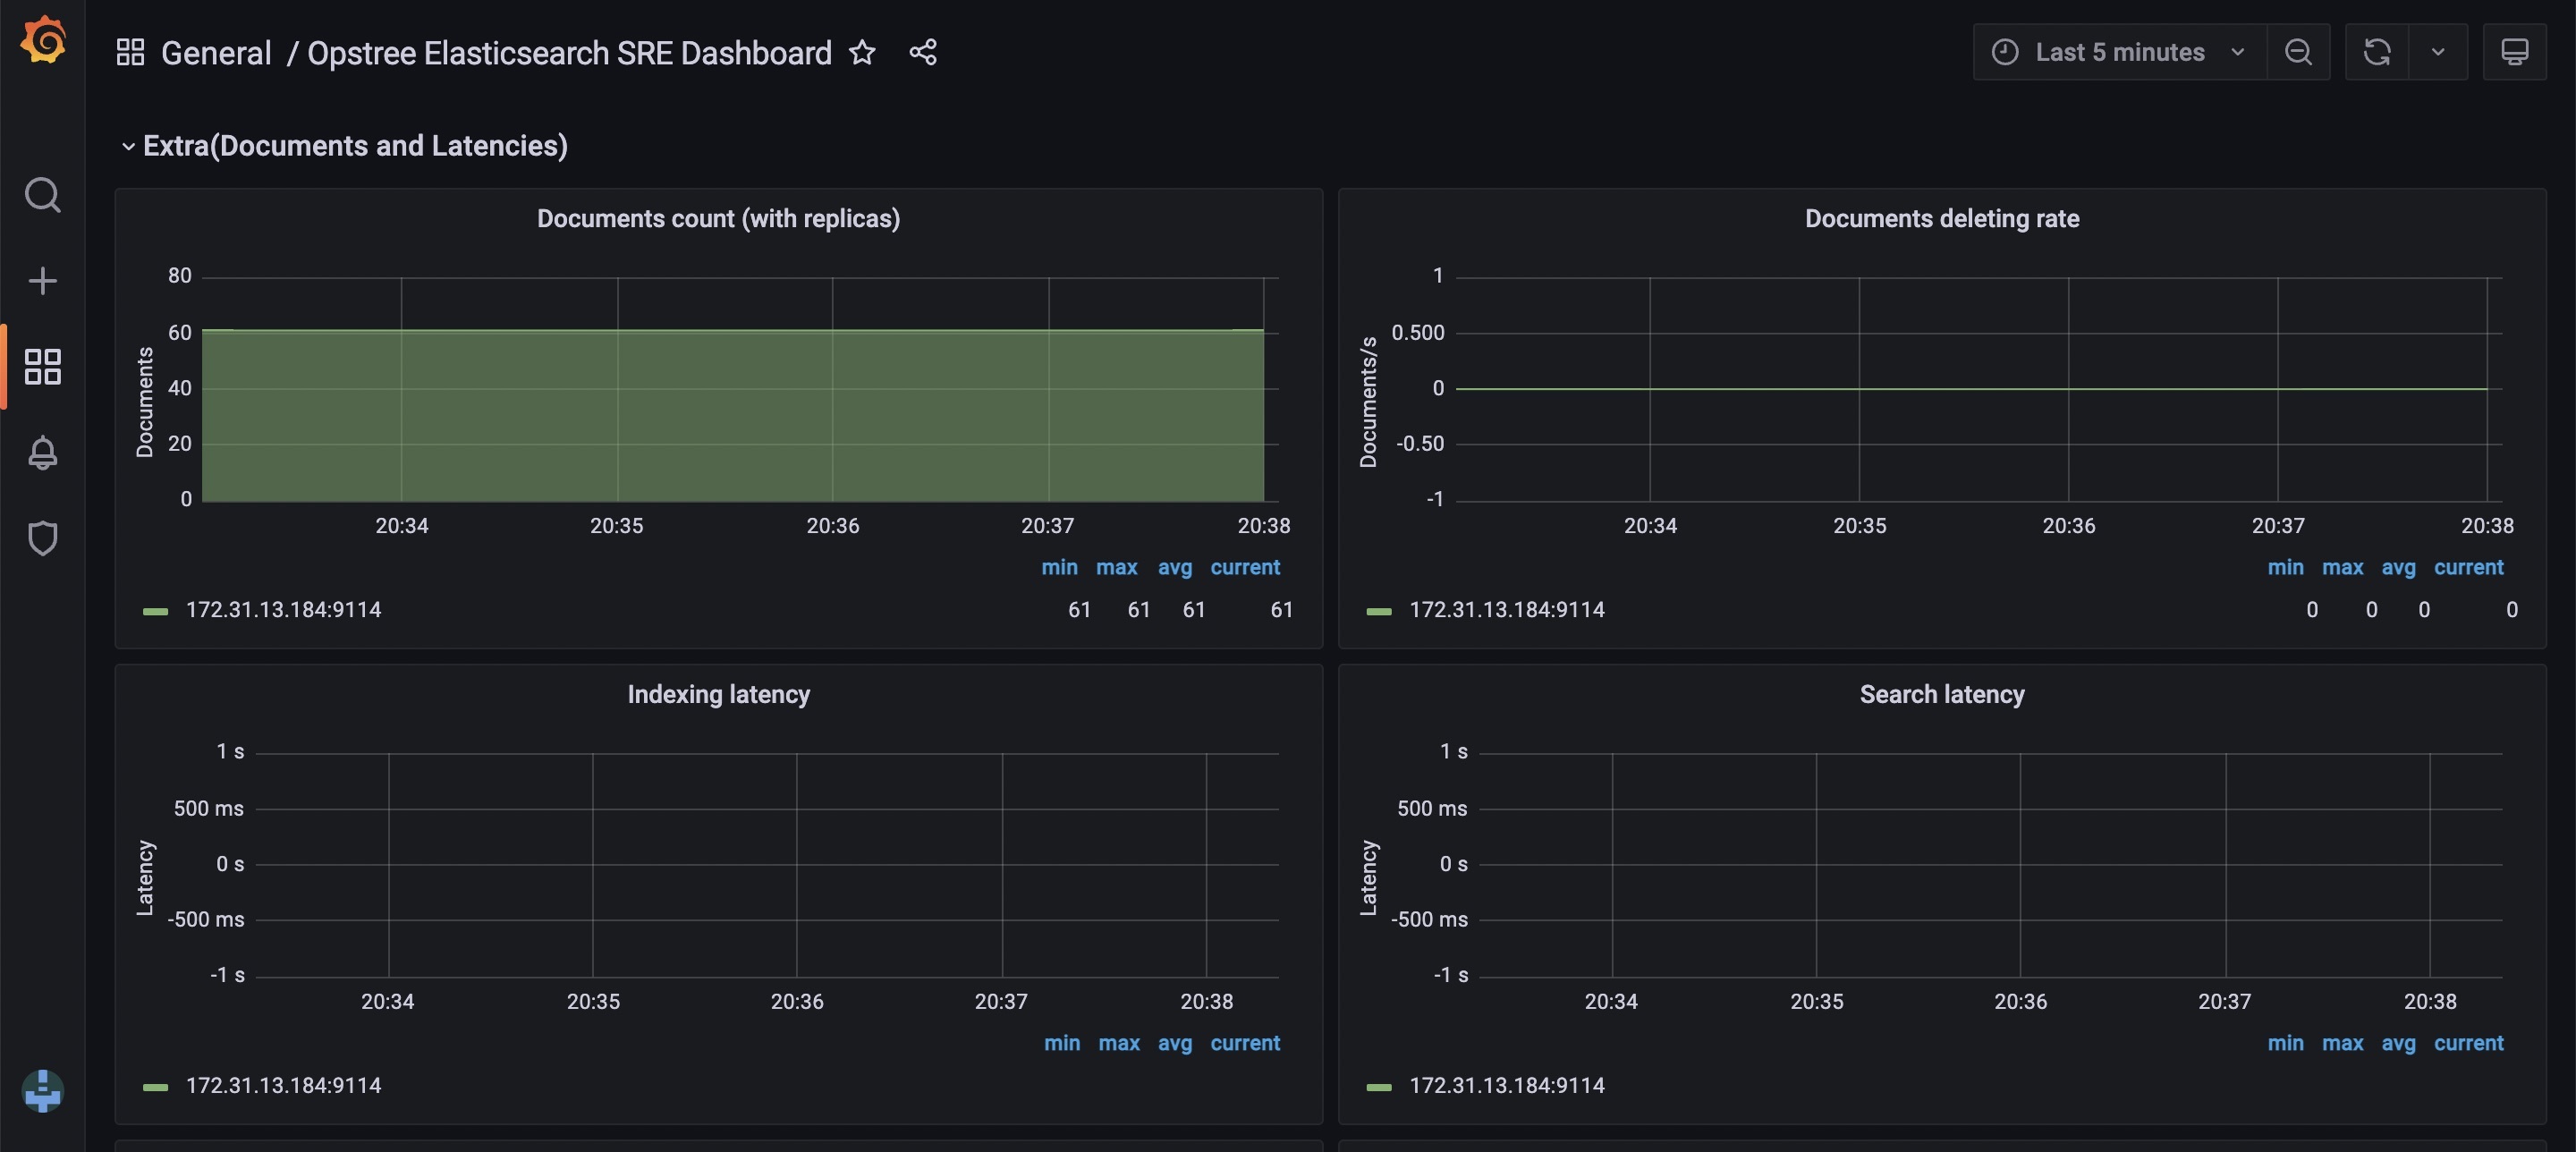
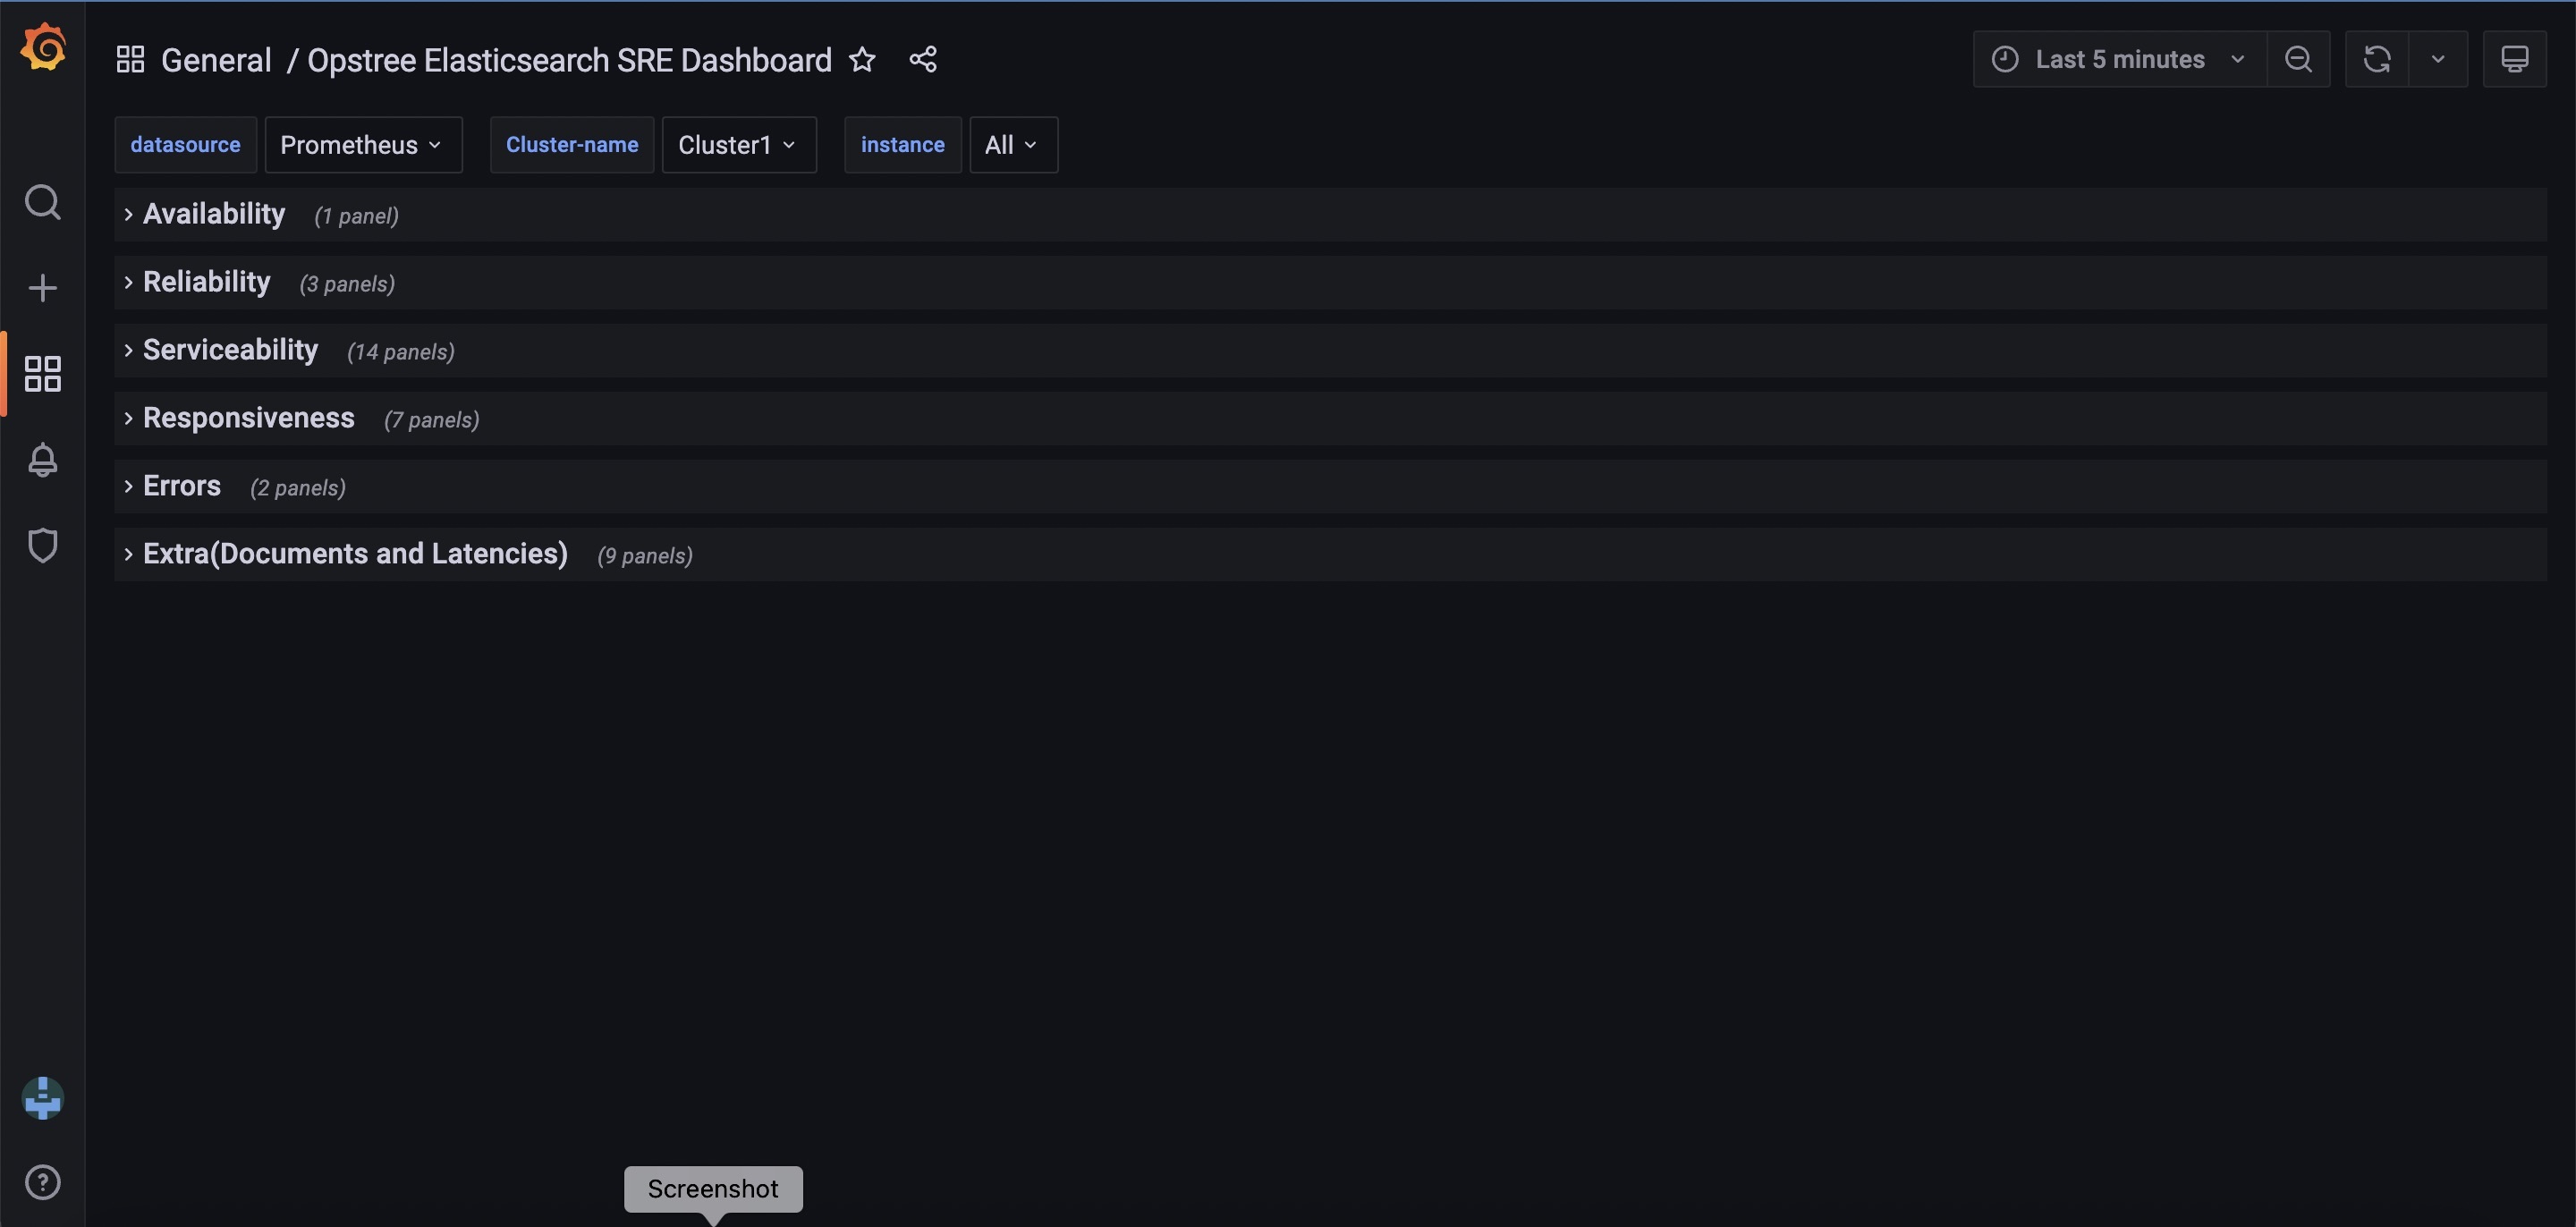
##ES Metrics
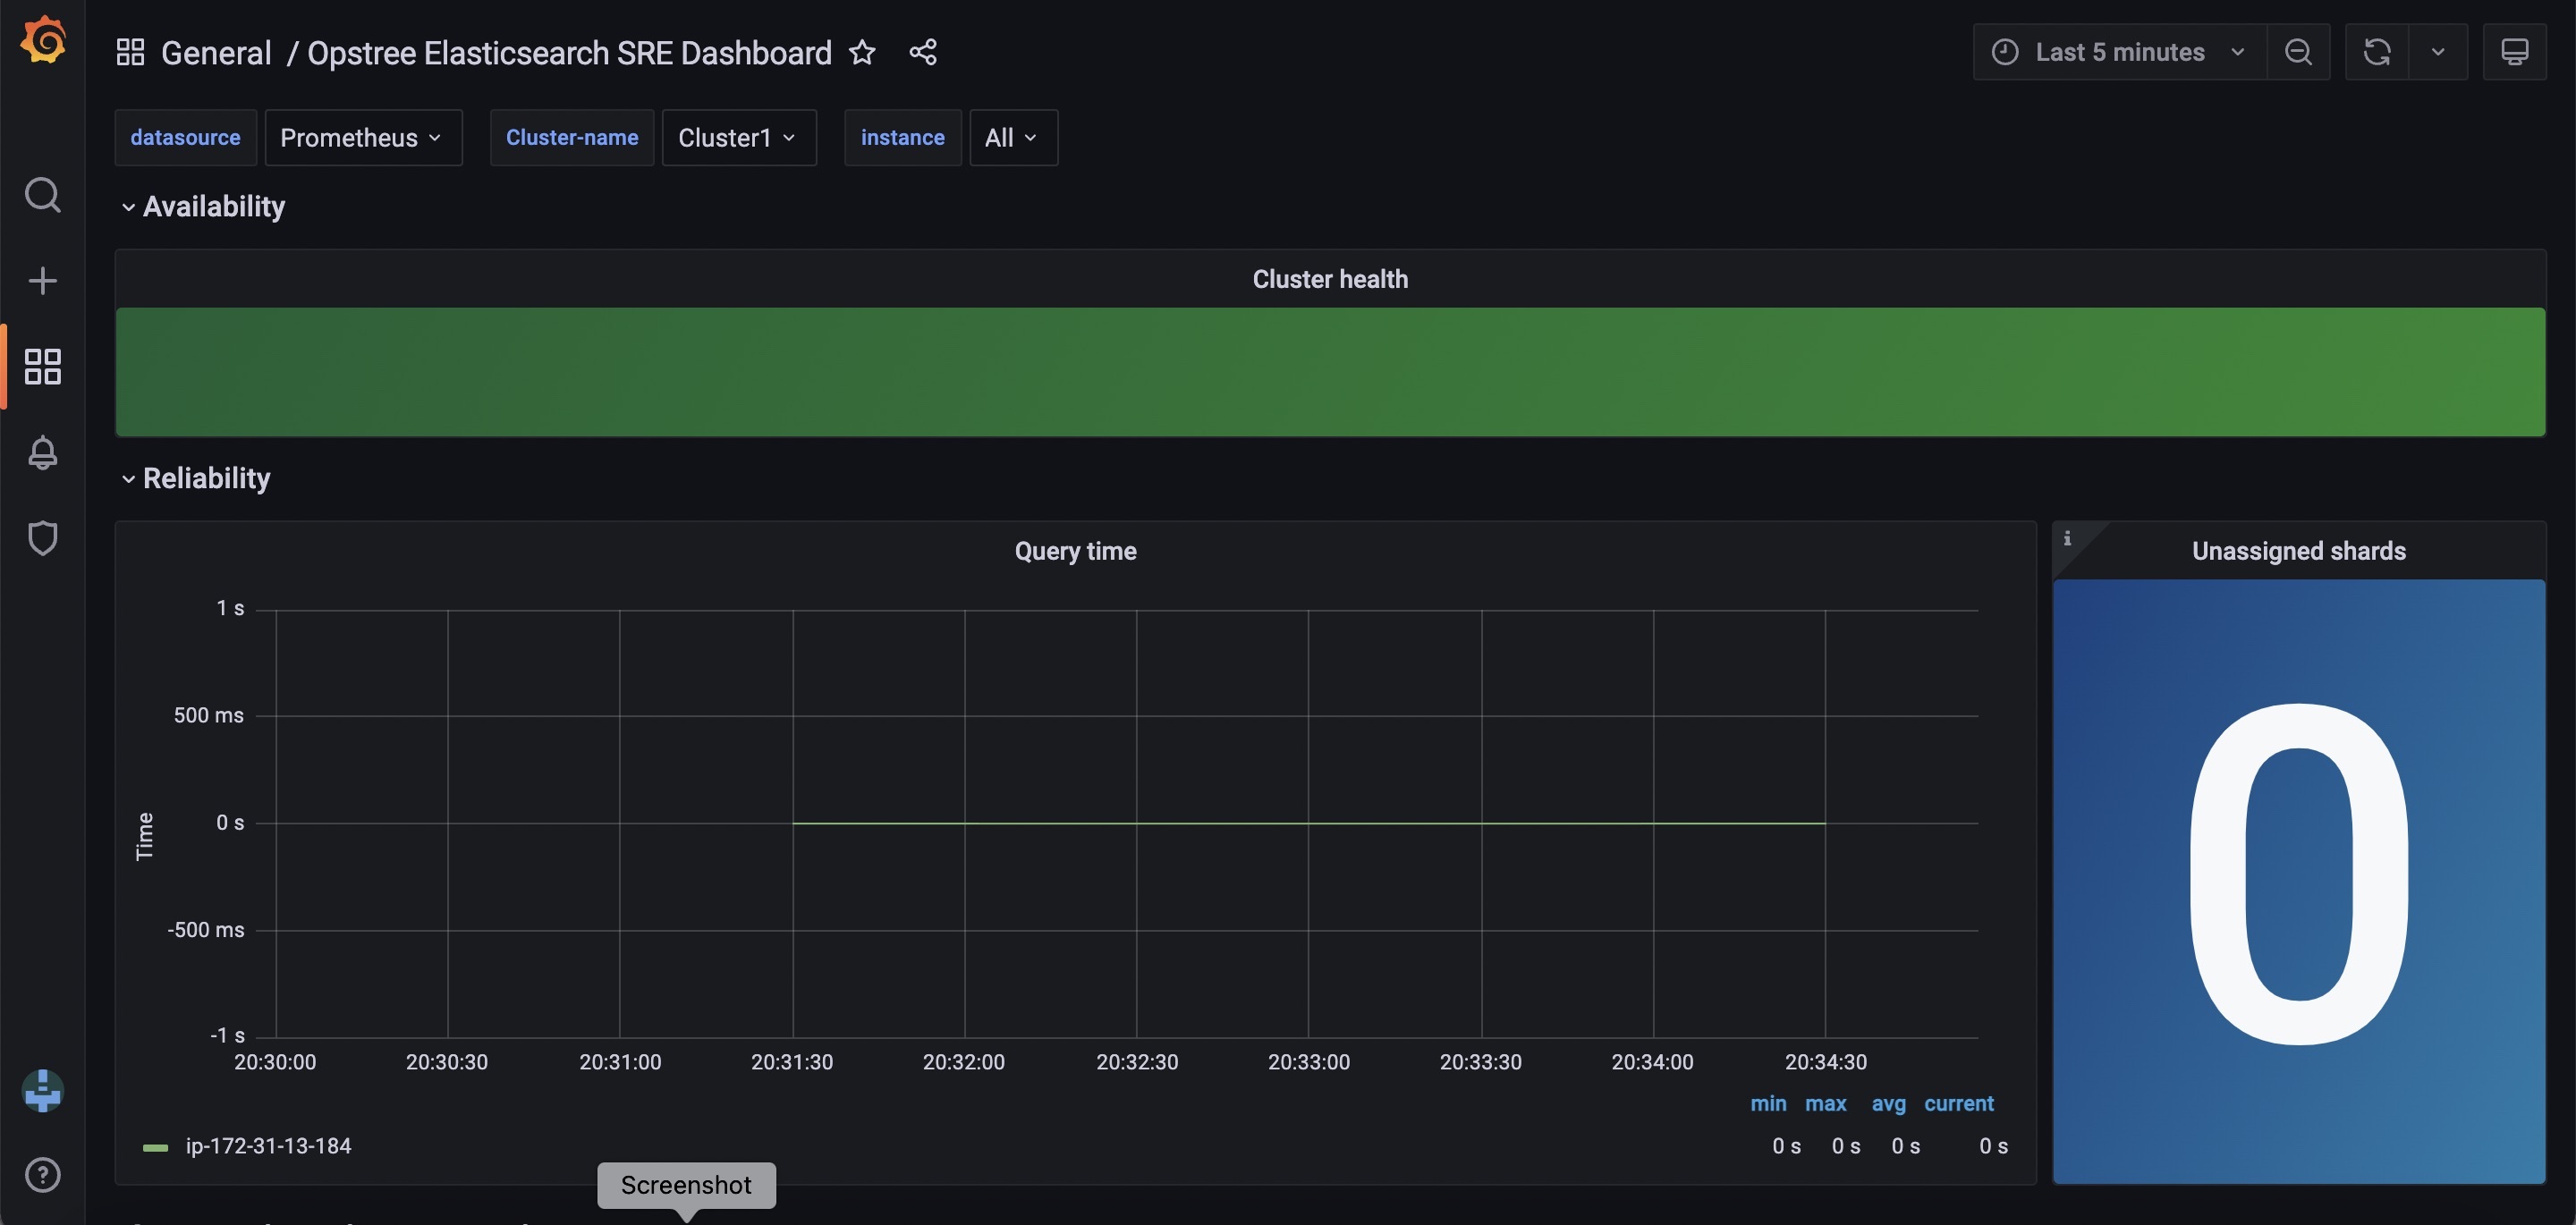
Availability:
- Cluster Health
Reliability:
- Unassigned Shards
- Query Time
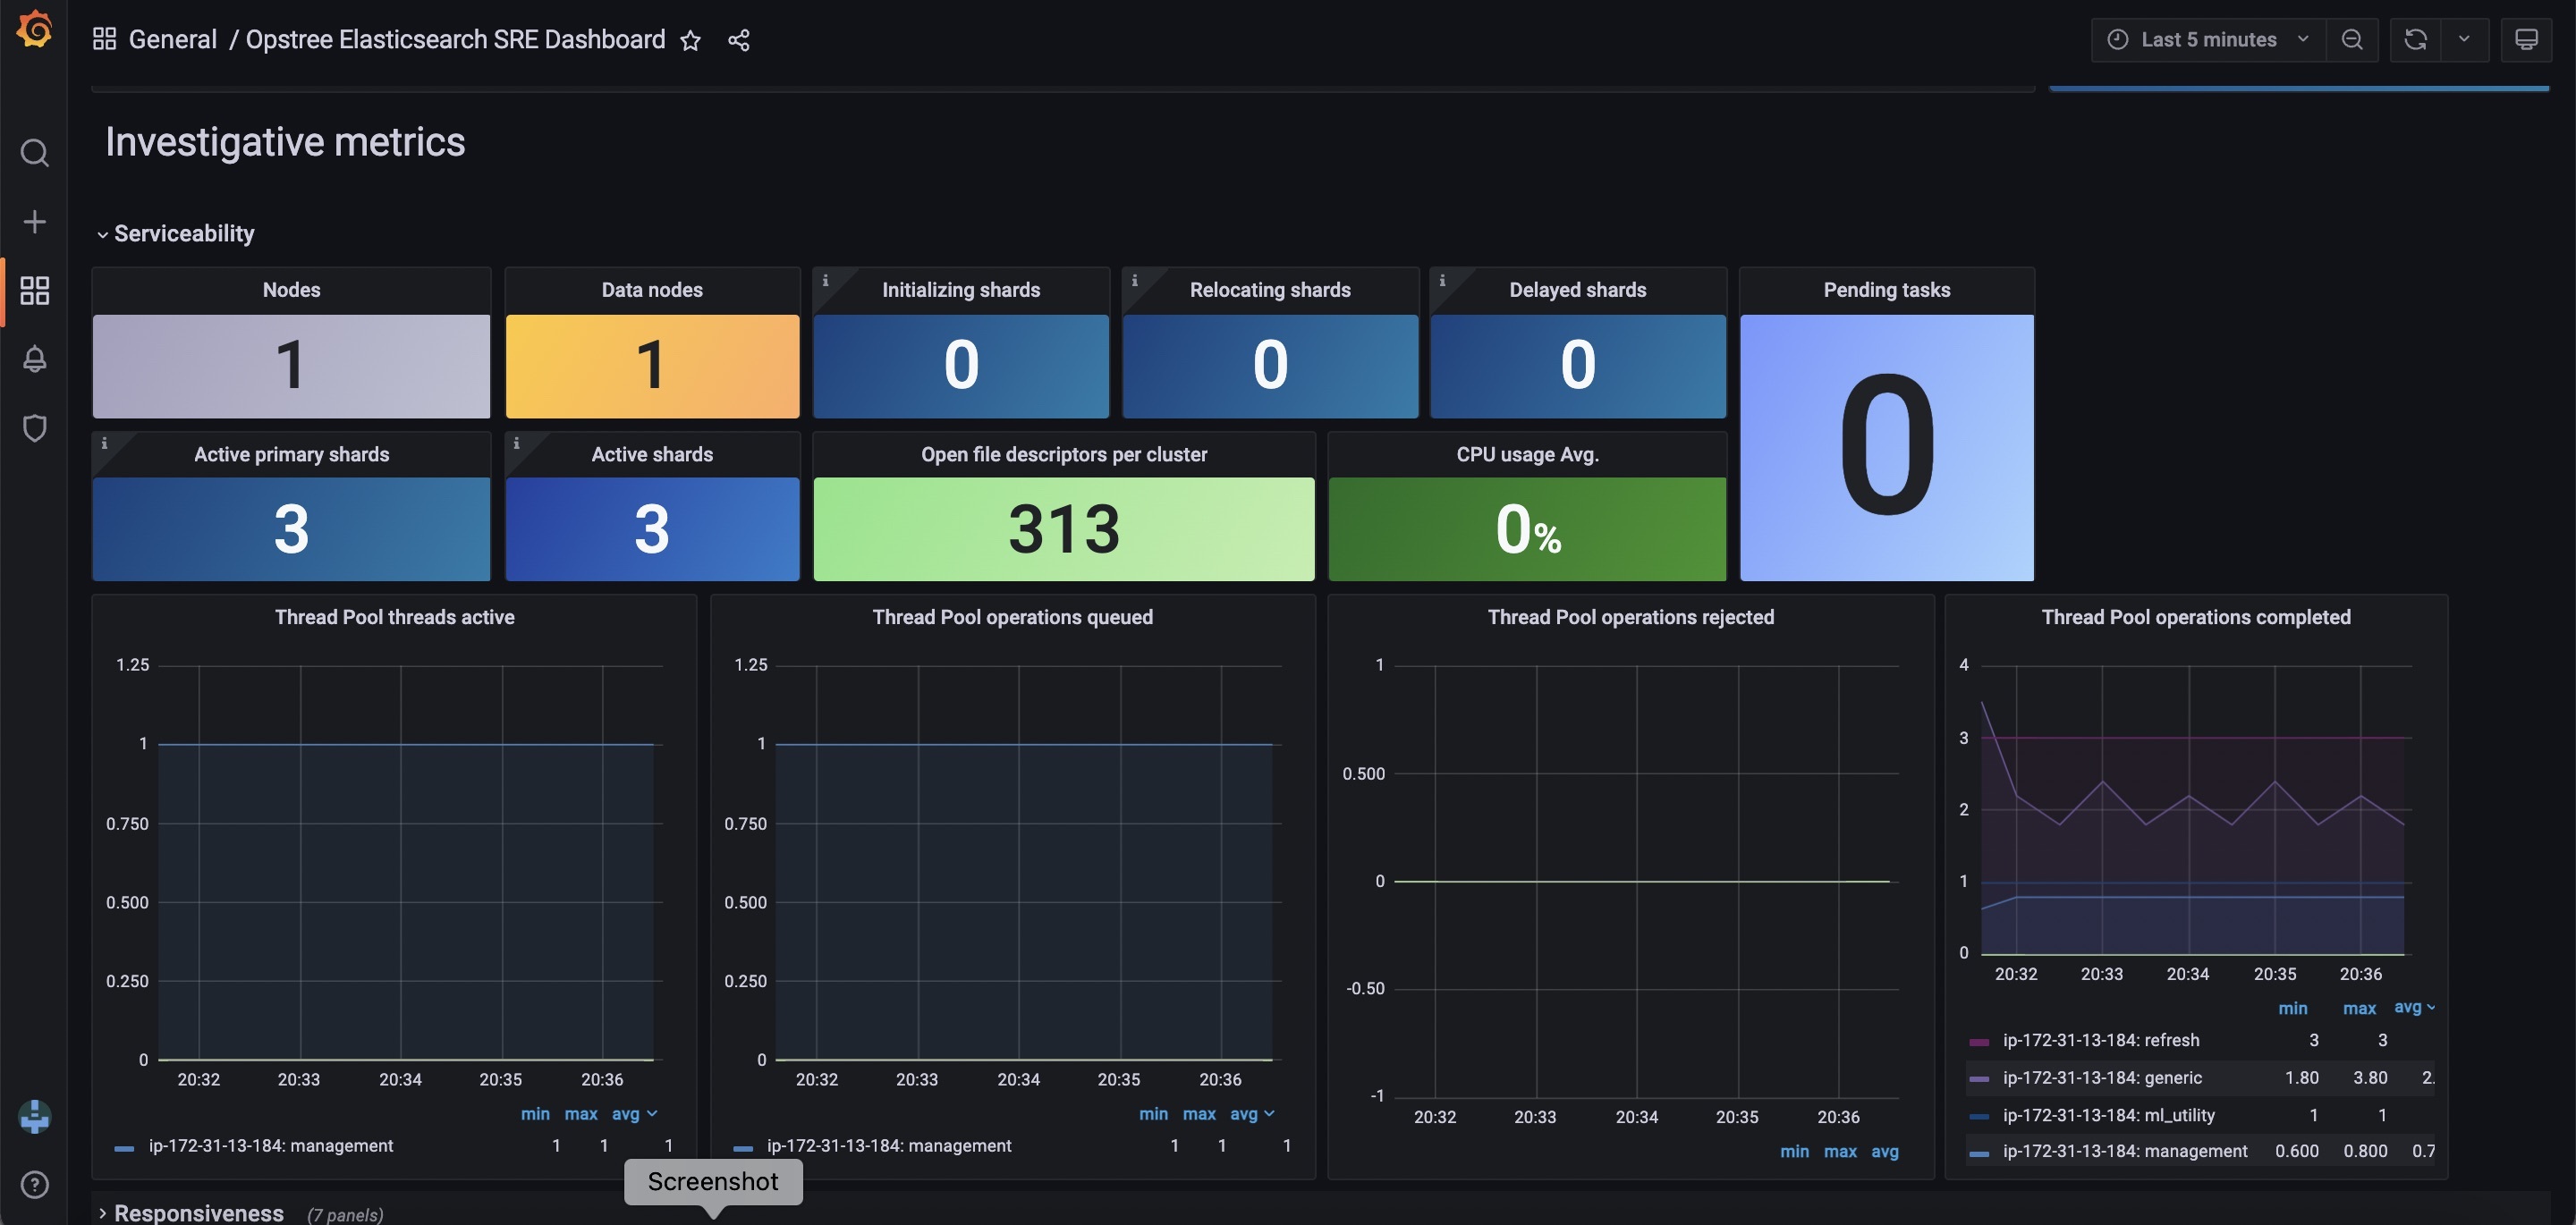
Serviceability:
- Active Shard
- Initializing Shards
- Reallocating Shards
- Delayed Shards
- Thread Pool Queued
- Thread Pool Active
- Thread Pool Rejected
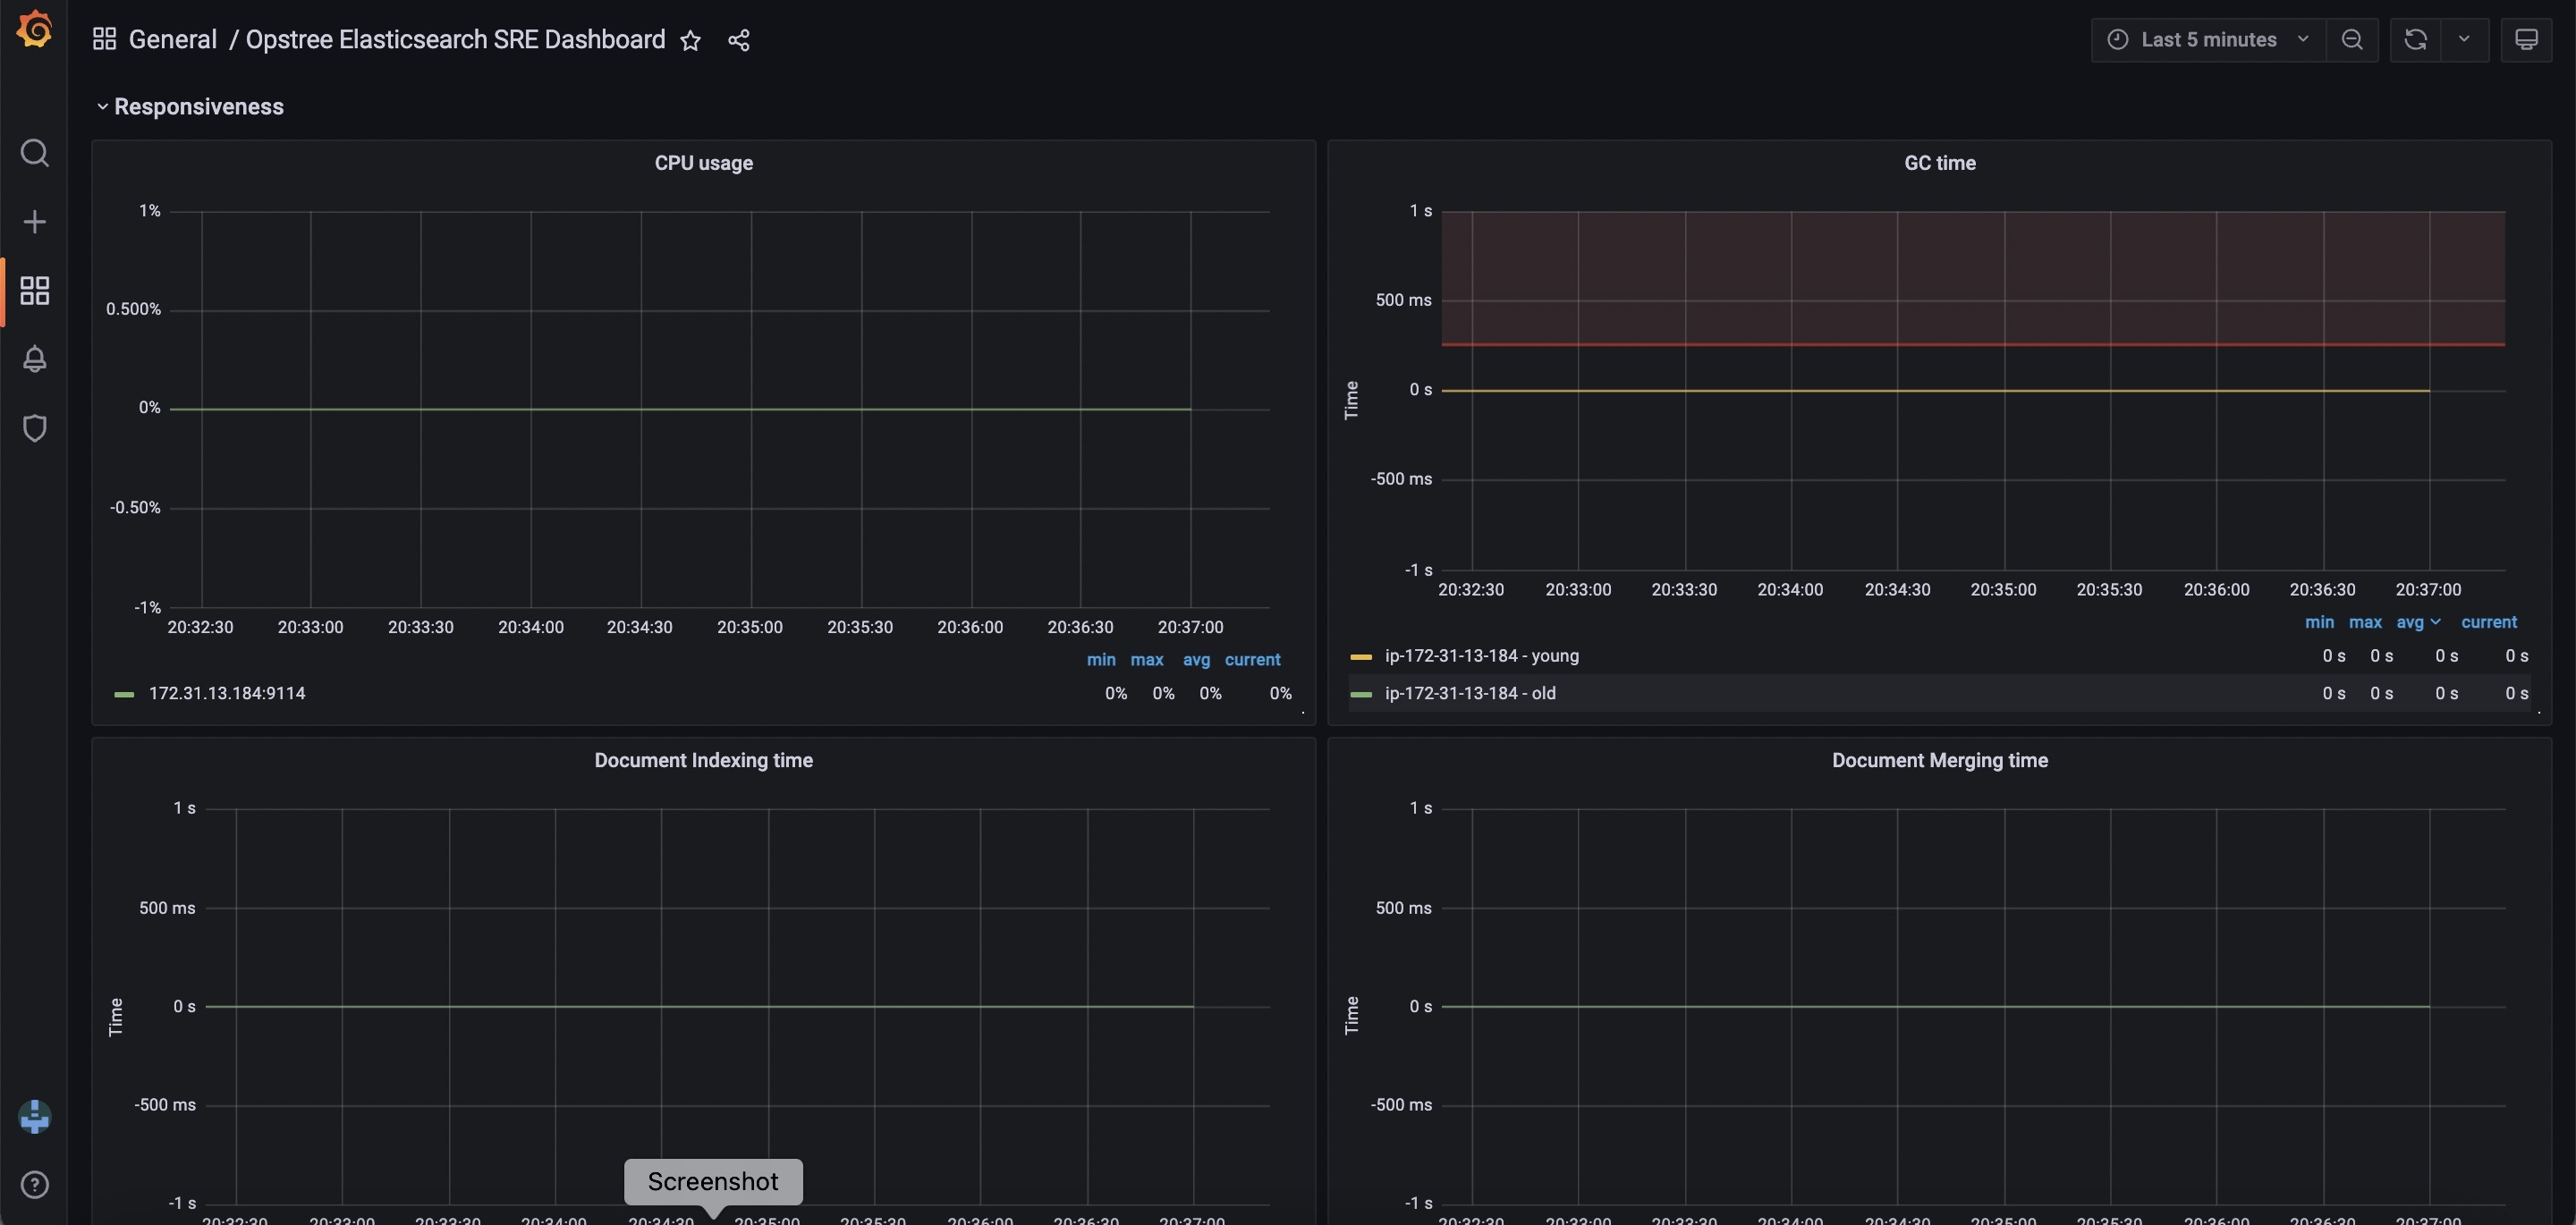
- GC Time
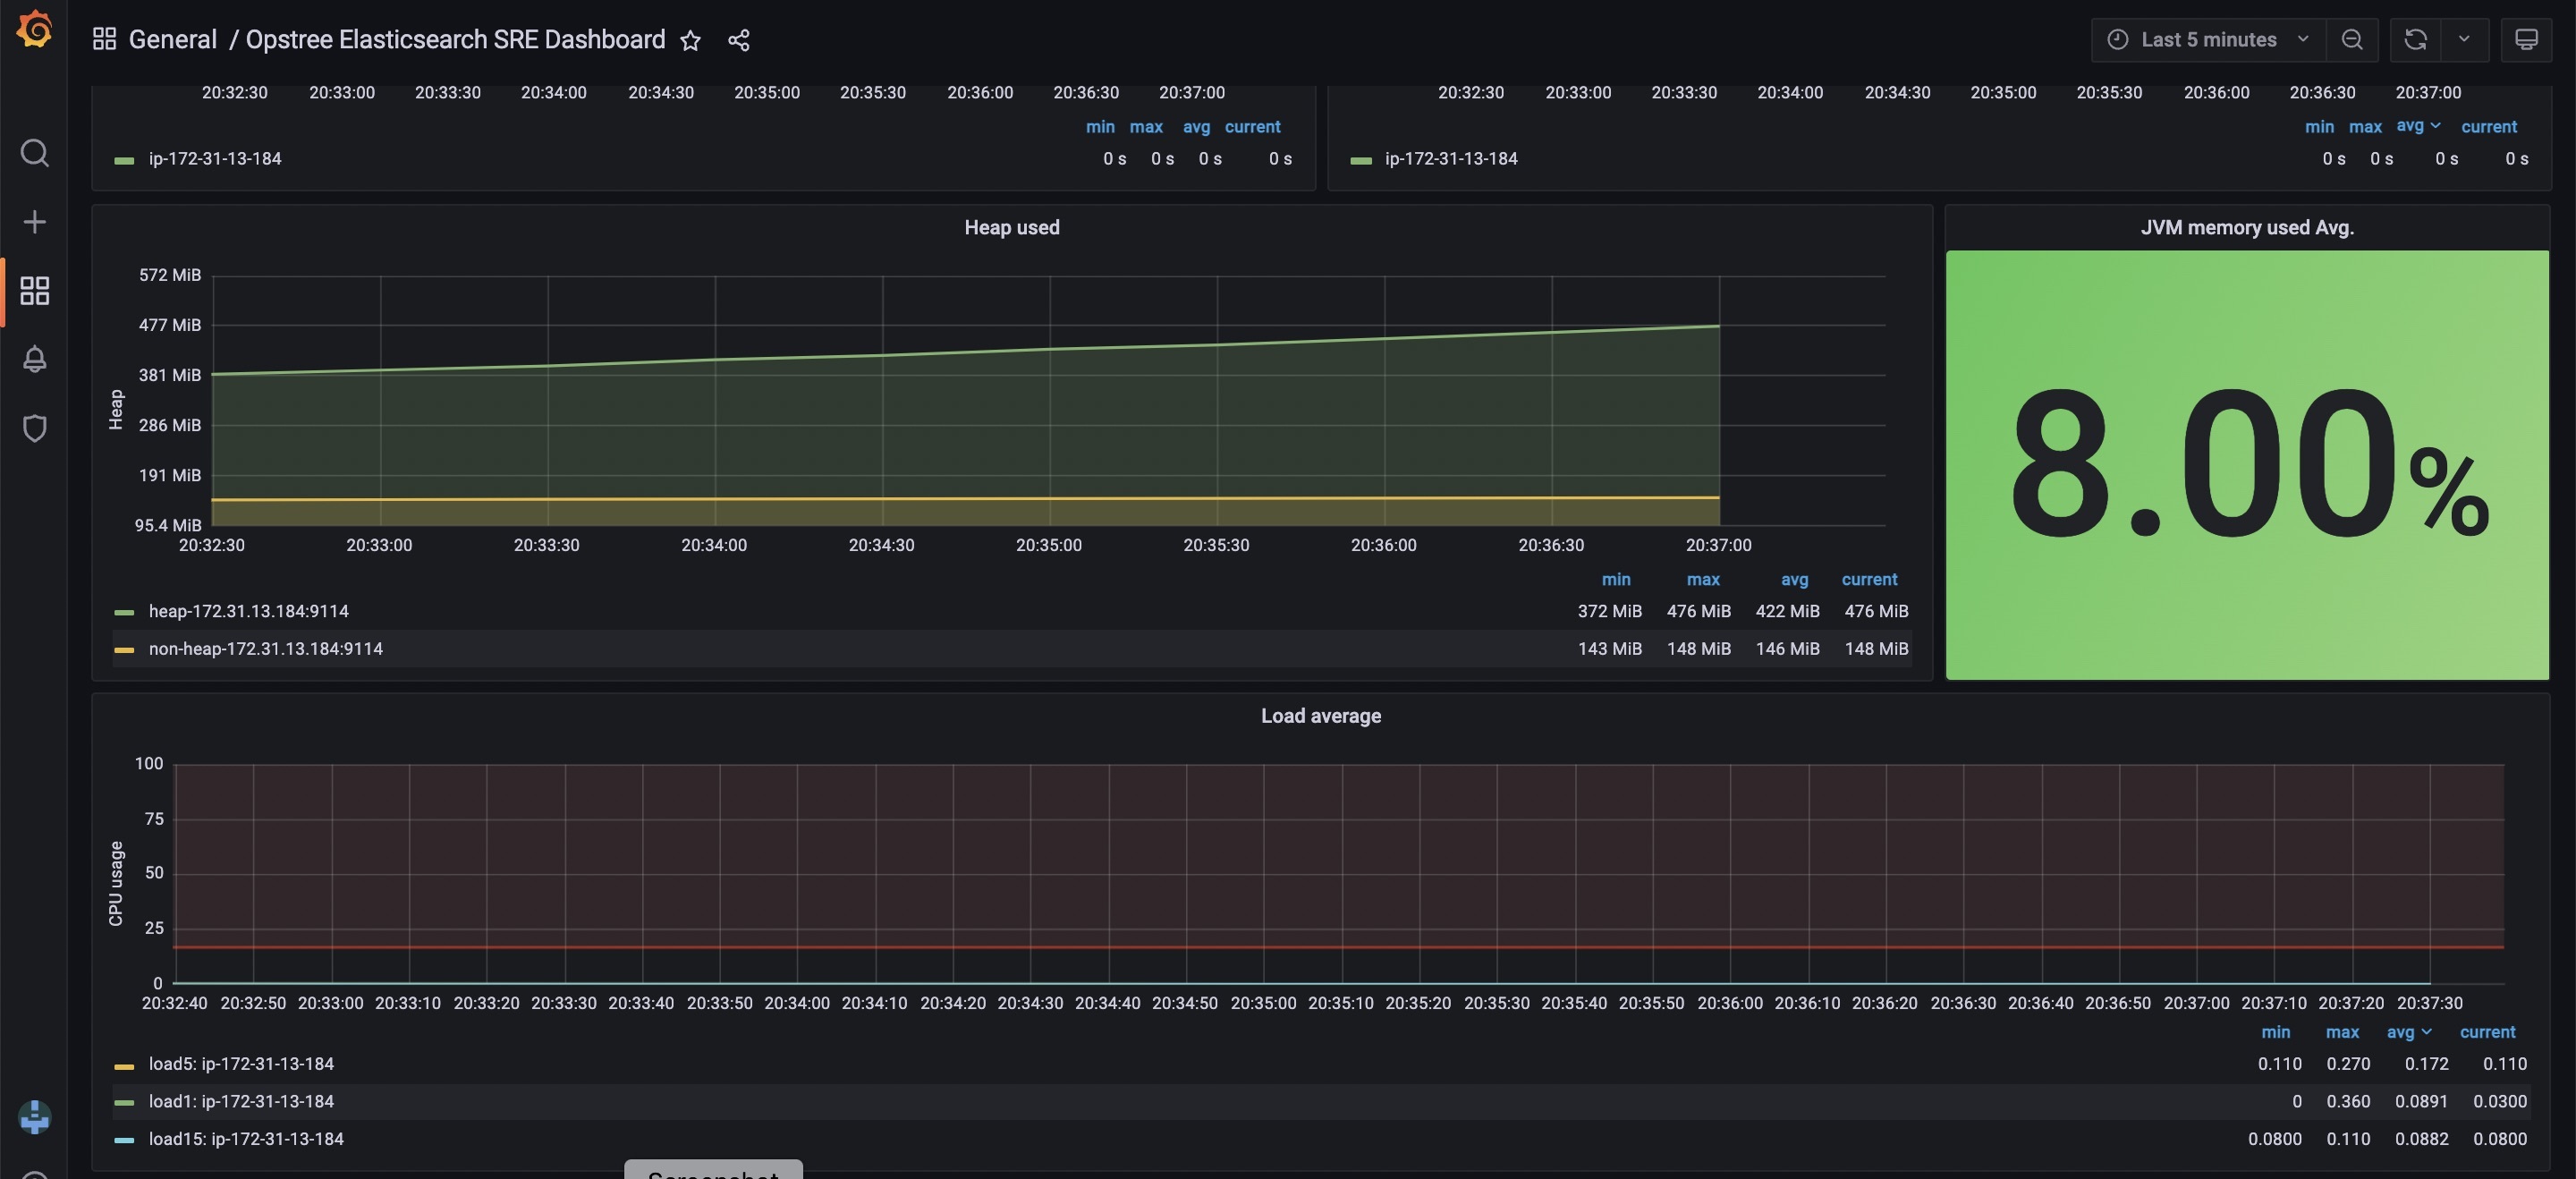
- JVM Heap Utilization
- CPU Utilization
- Load Average
- Indexing Time
- Merging Time
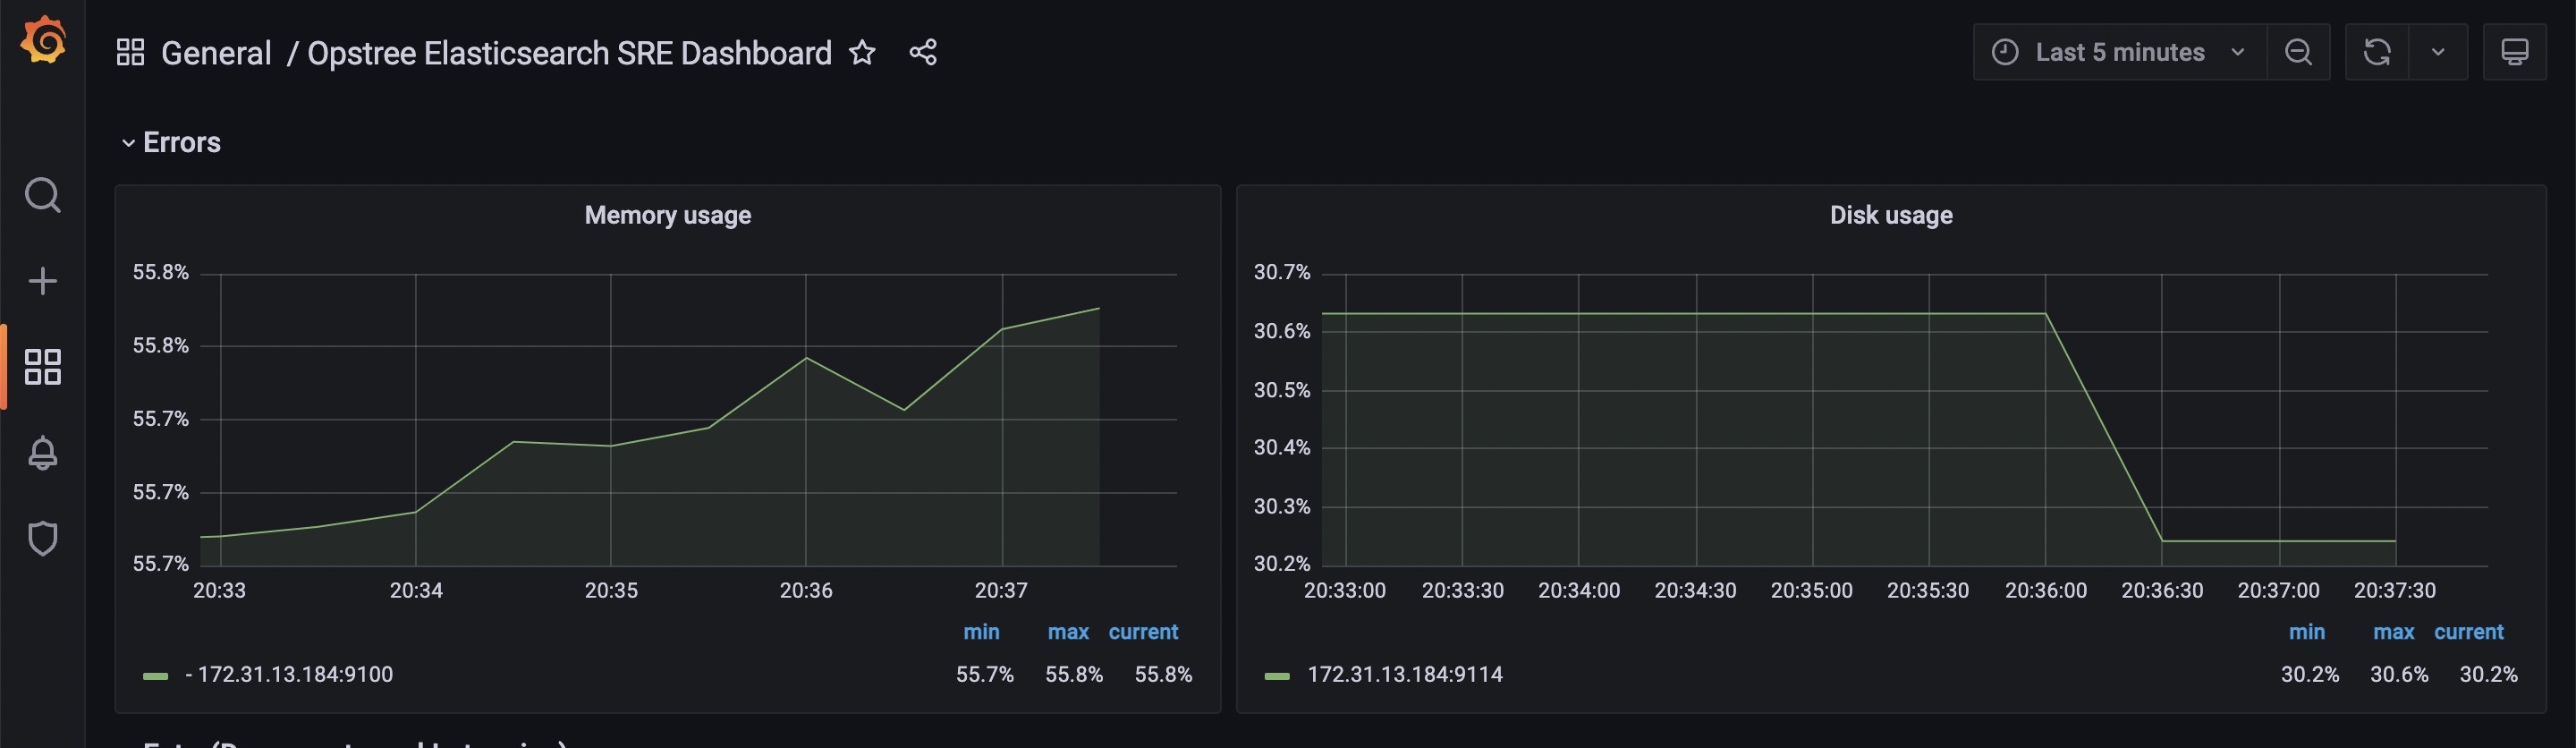
Error:
- Node failure
- Disk utilization
Contributor Information
Data source config
Collector type:
Collector plugins:
Collector config:
Revisions
Upload an updated version of an exported dashboard.json file from Grafana
| Revision | Description | Created | |
|---|---|---|---|
| Download |