
Opstree/Node Exporter SRE Dashboard
Grafana Dashboard for Host Level Metrics using Node Exporter for SRE.
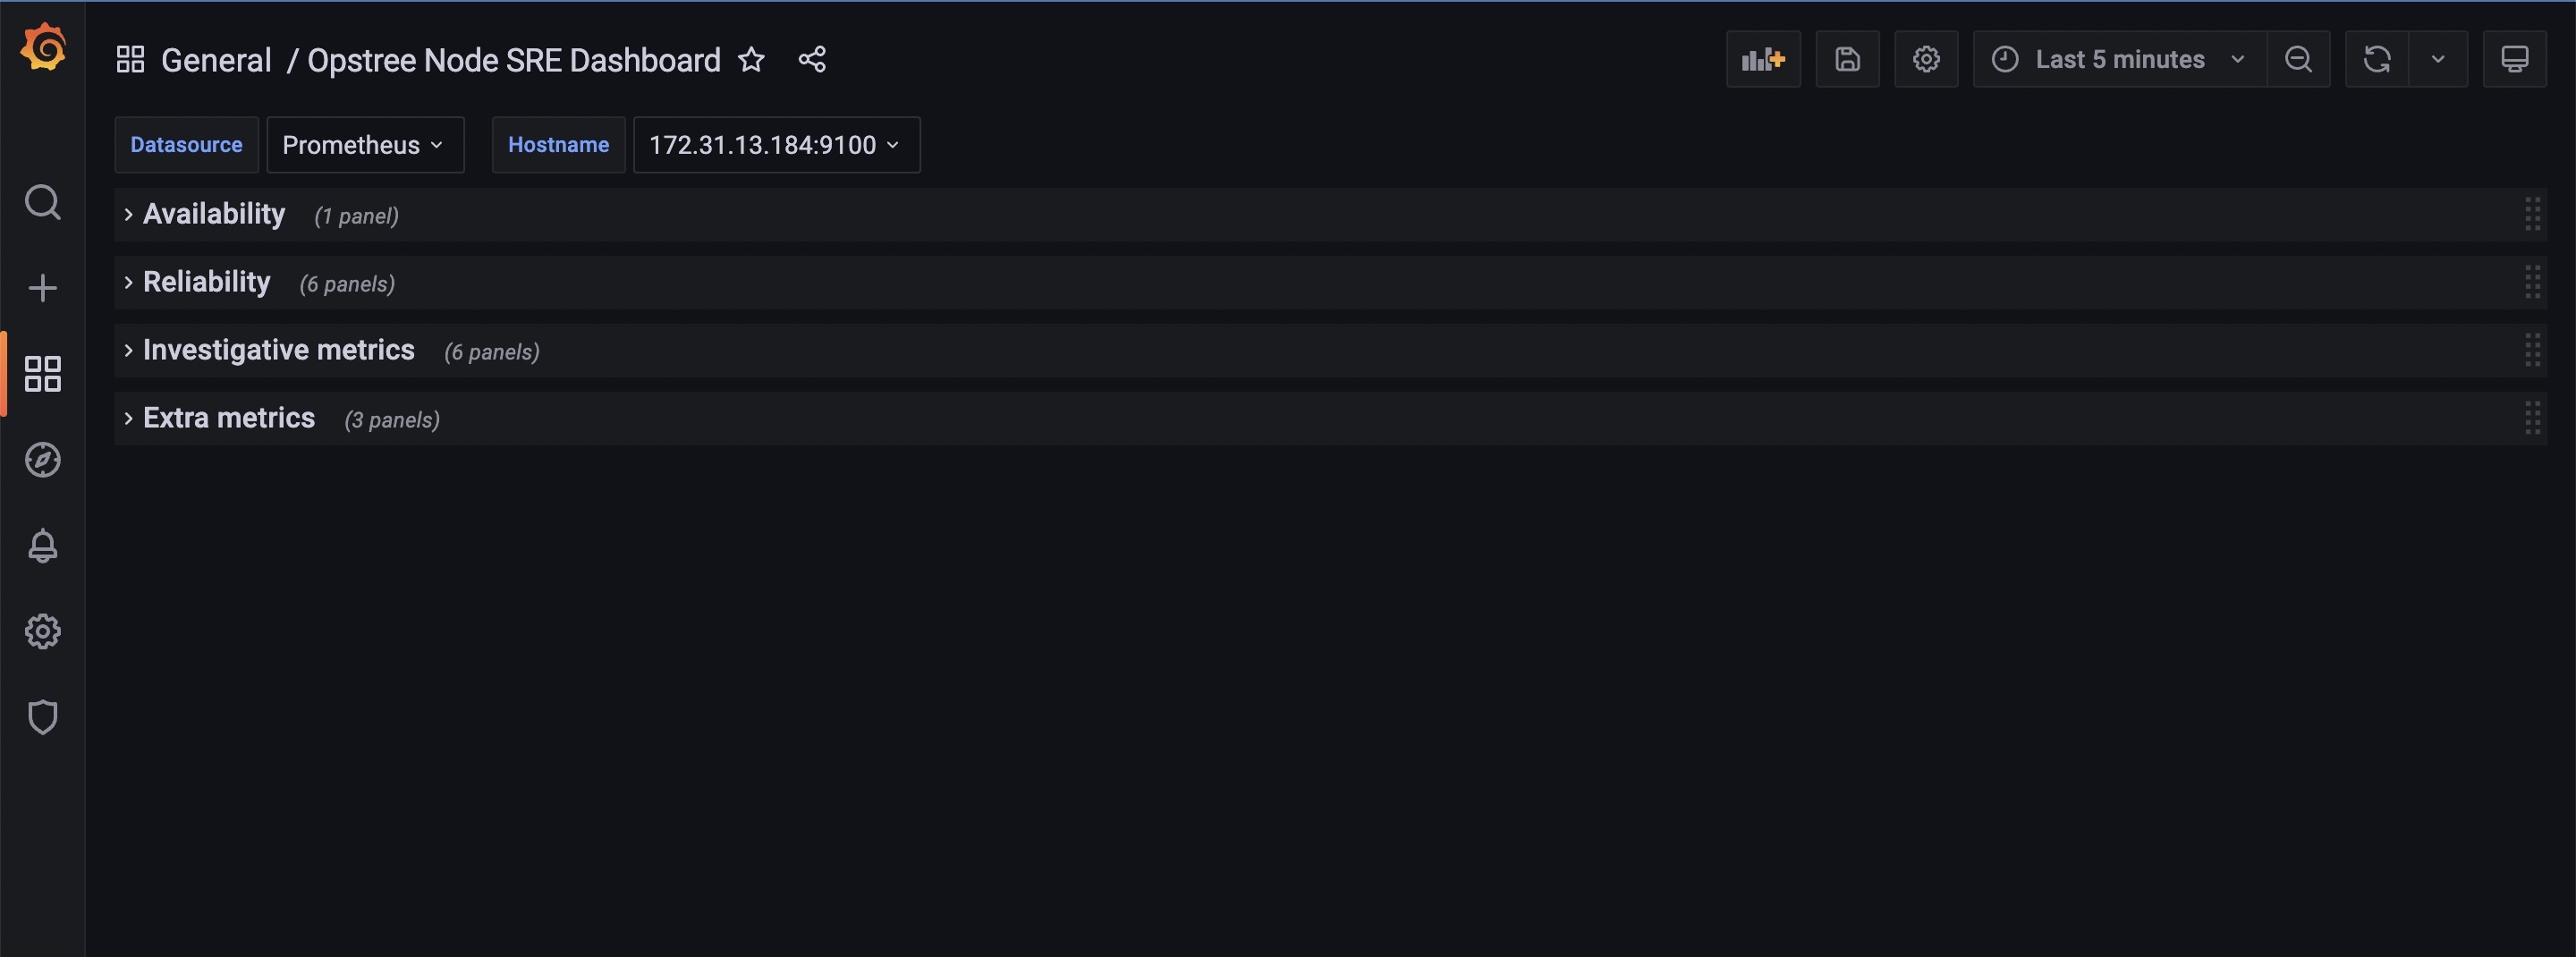
Metrics of Dashboards
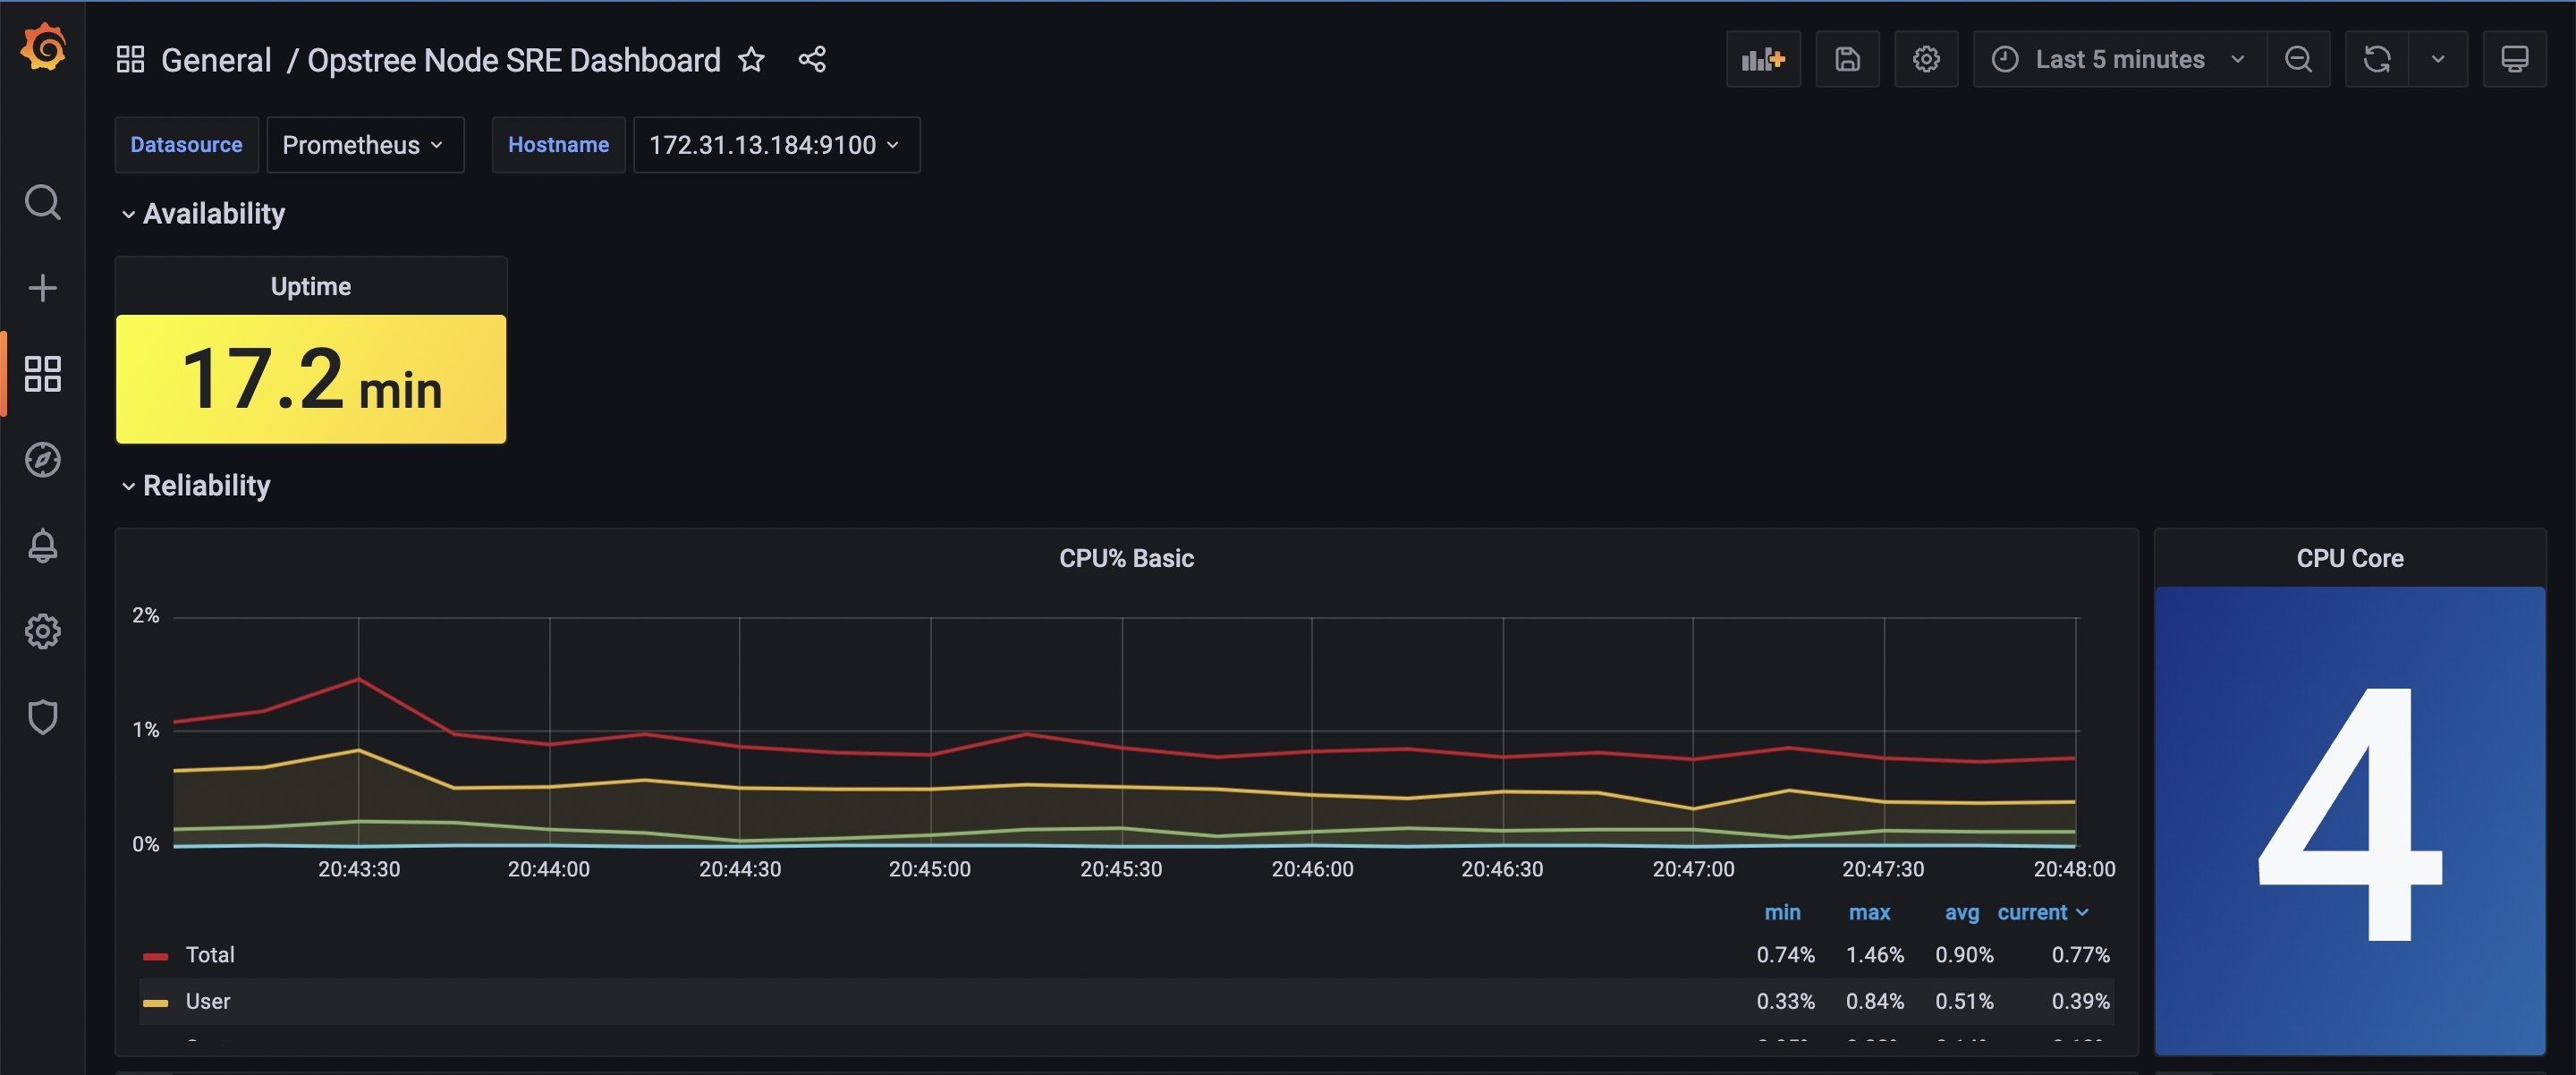
Availability:
- Uptime
Reliability:
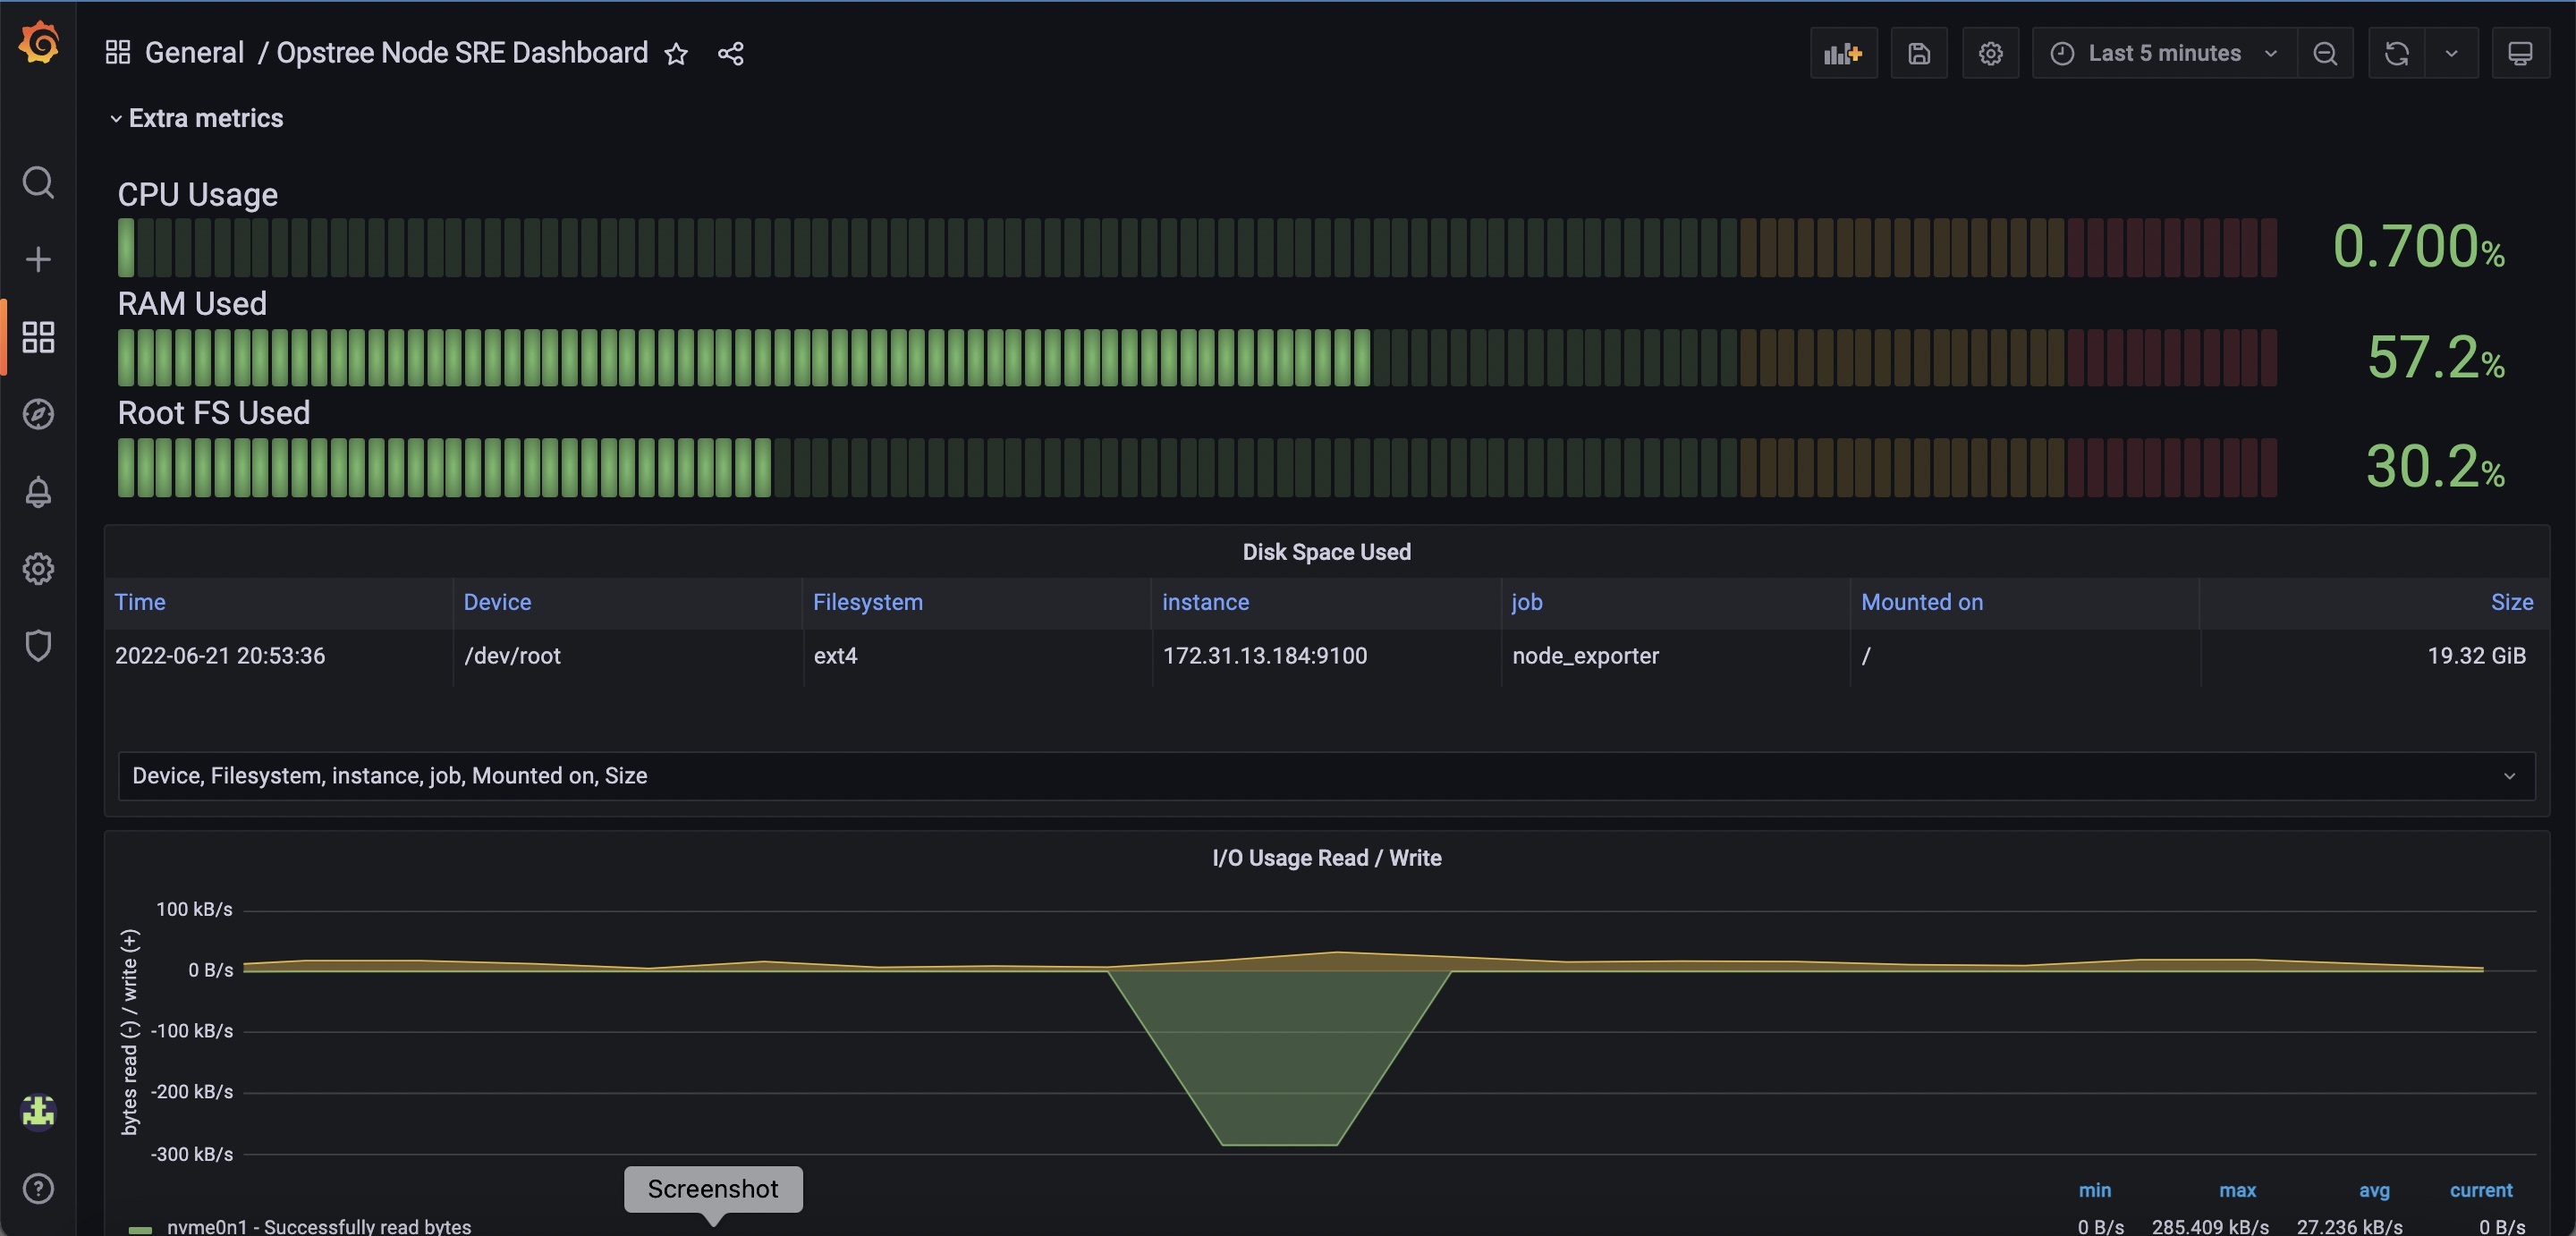
- CPU Usage
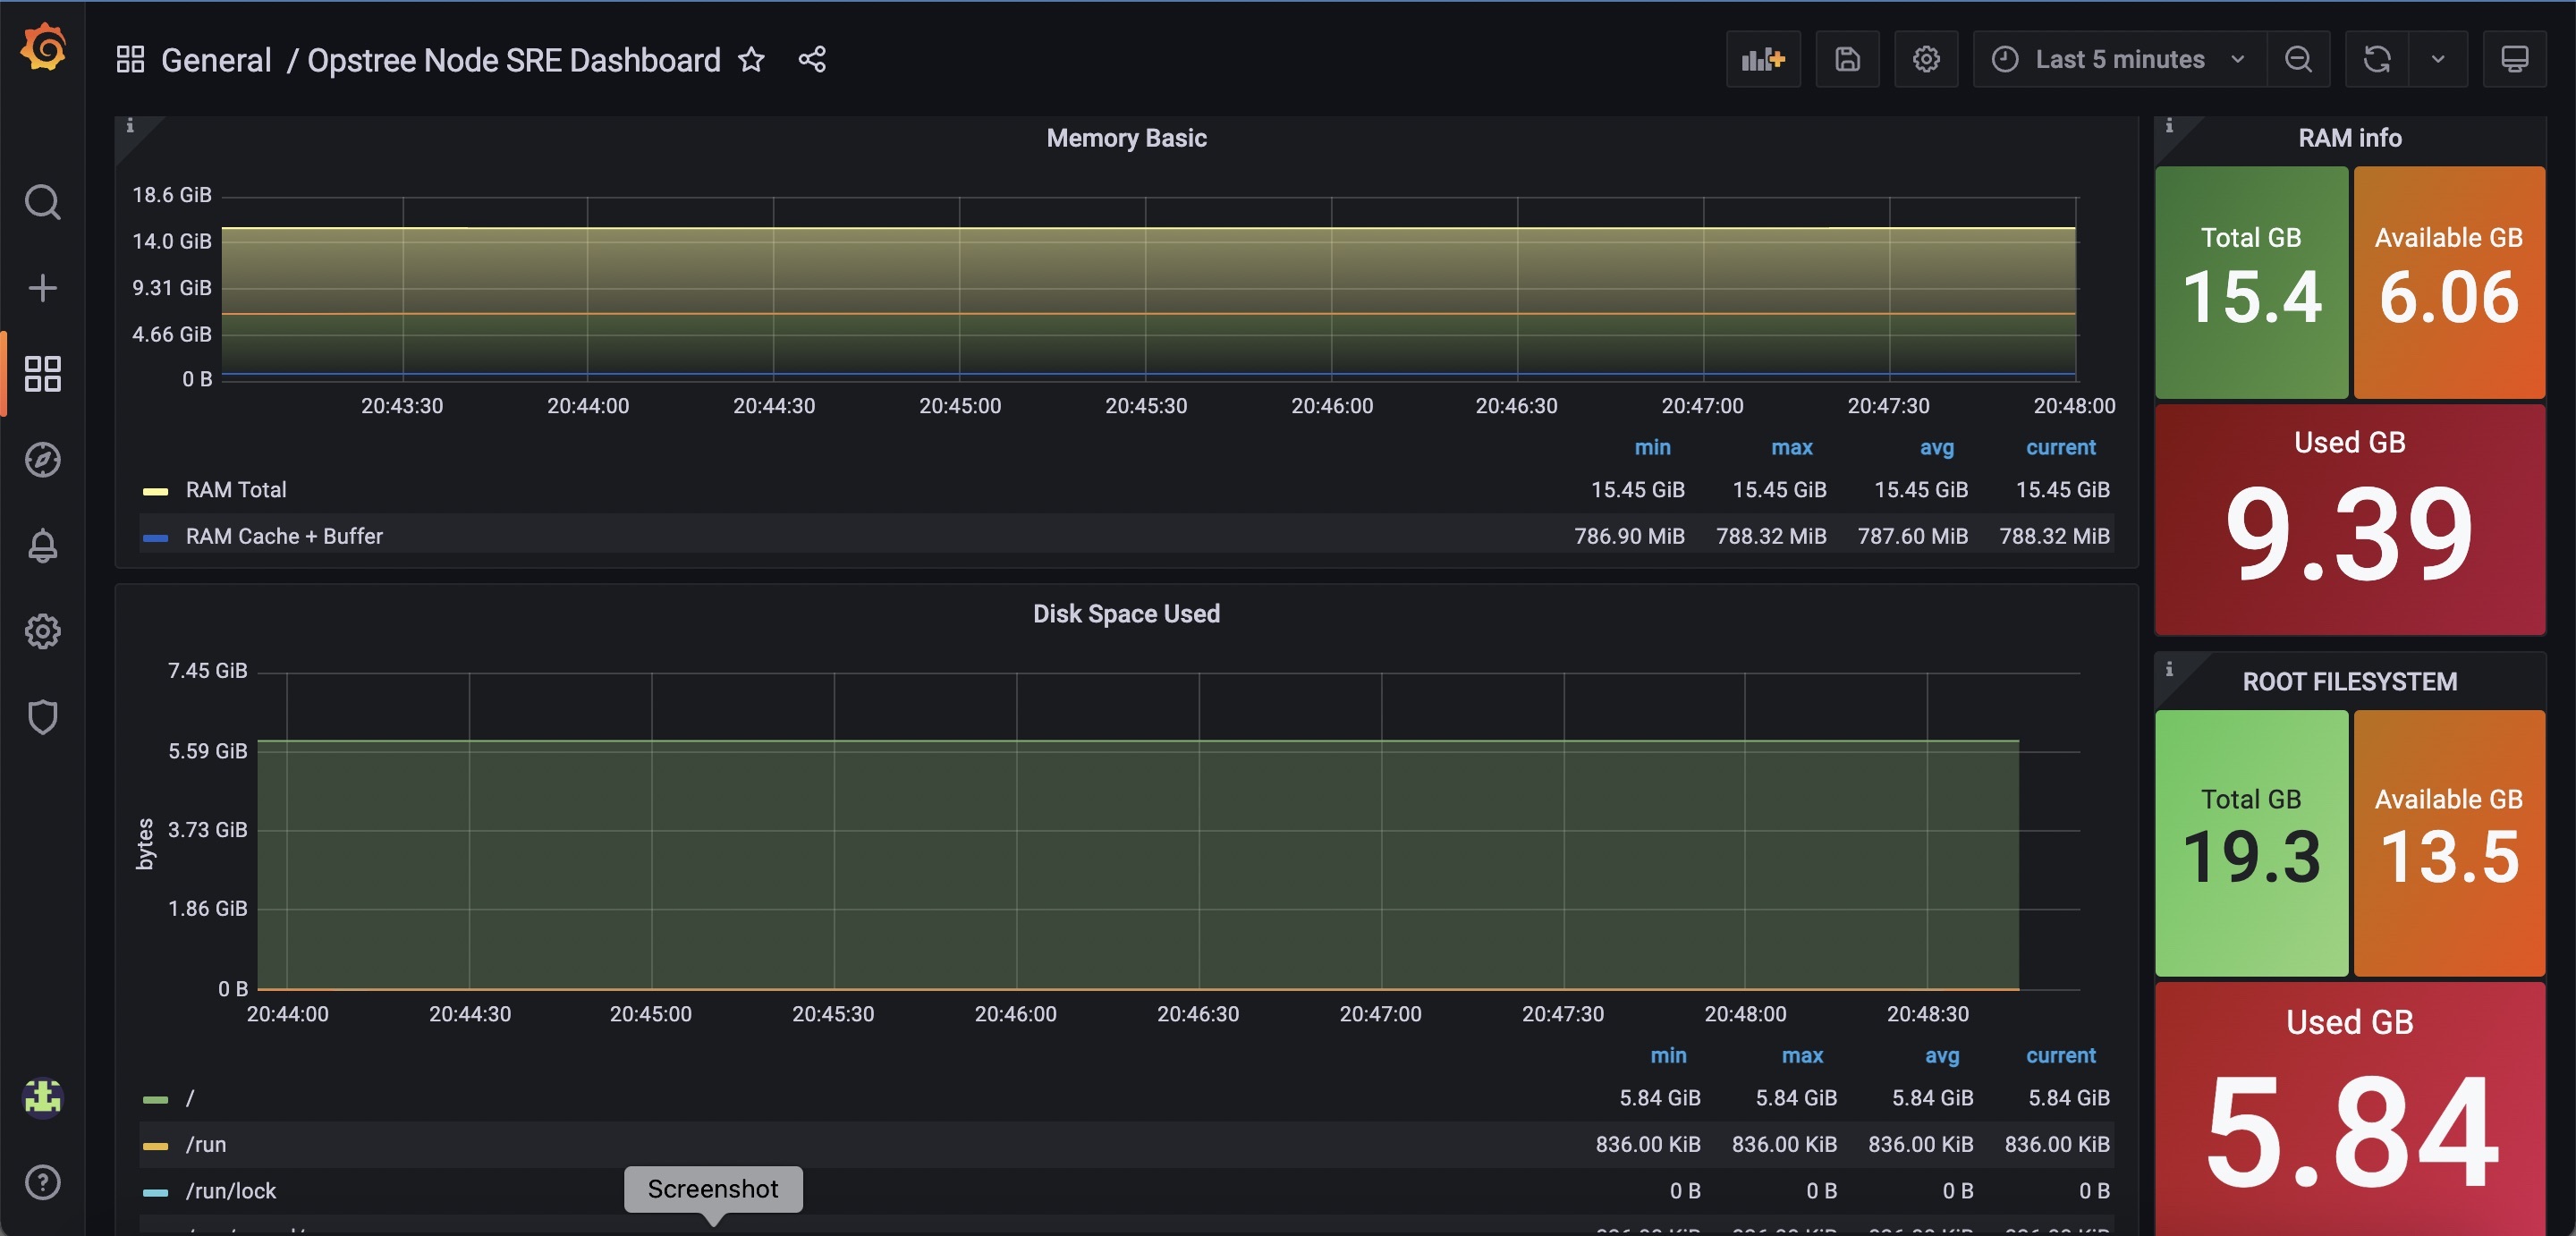
- Memory Usage
- Disk Usage
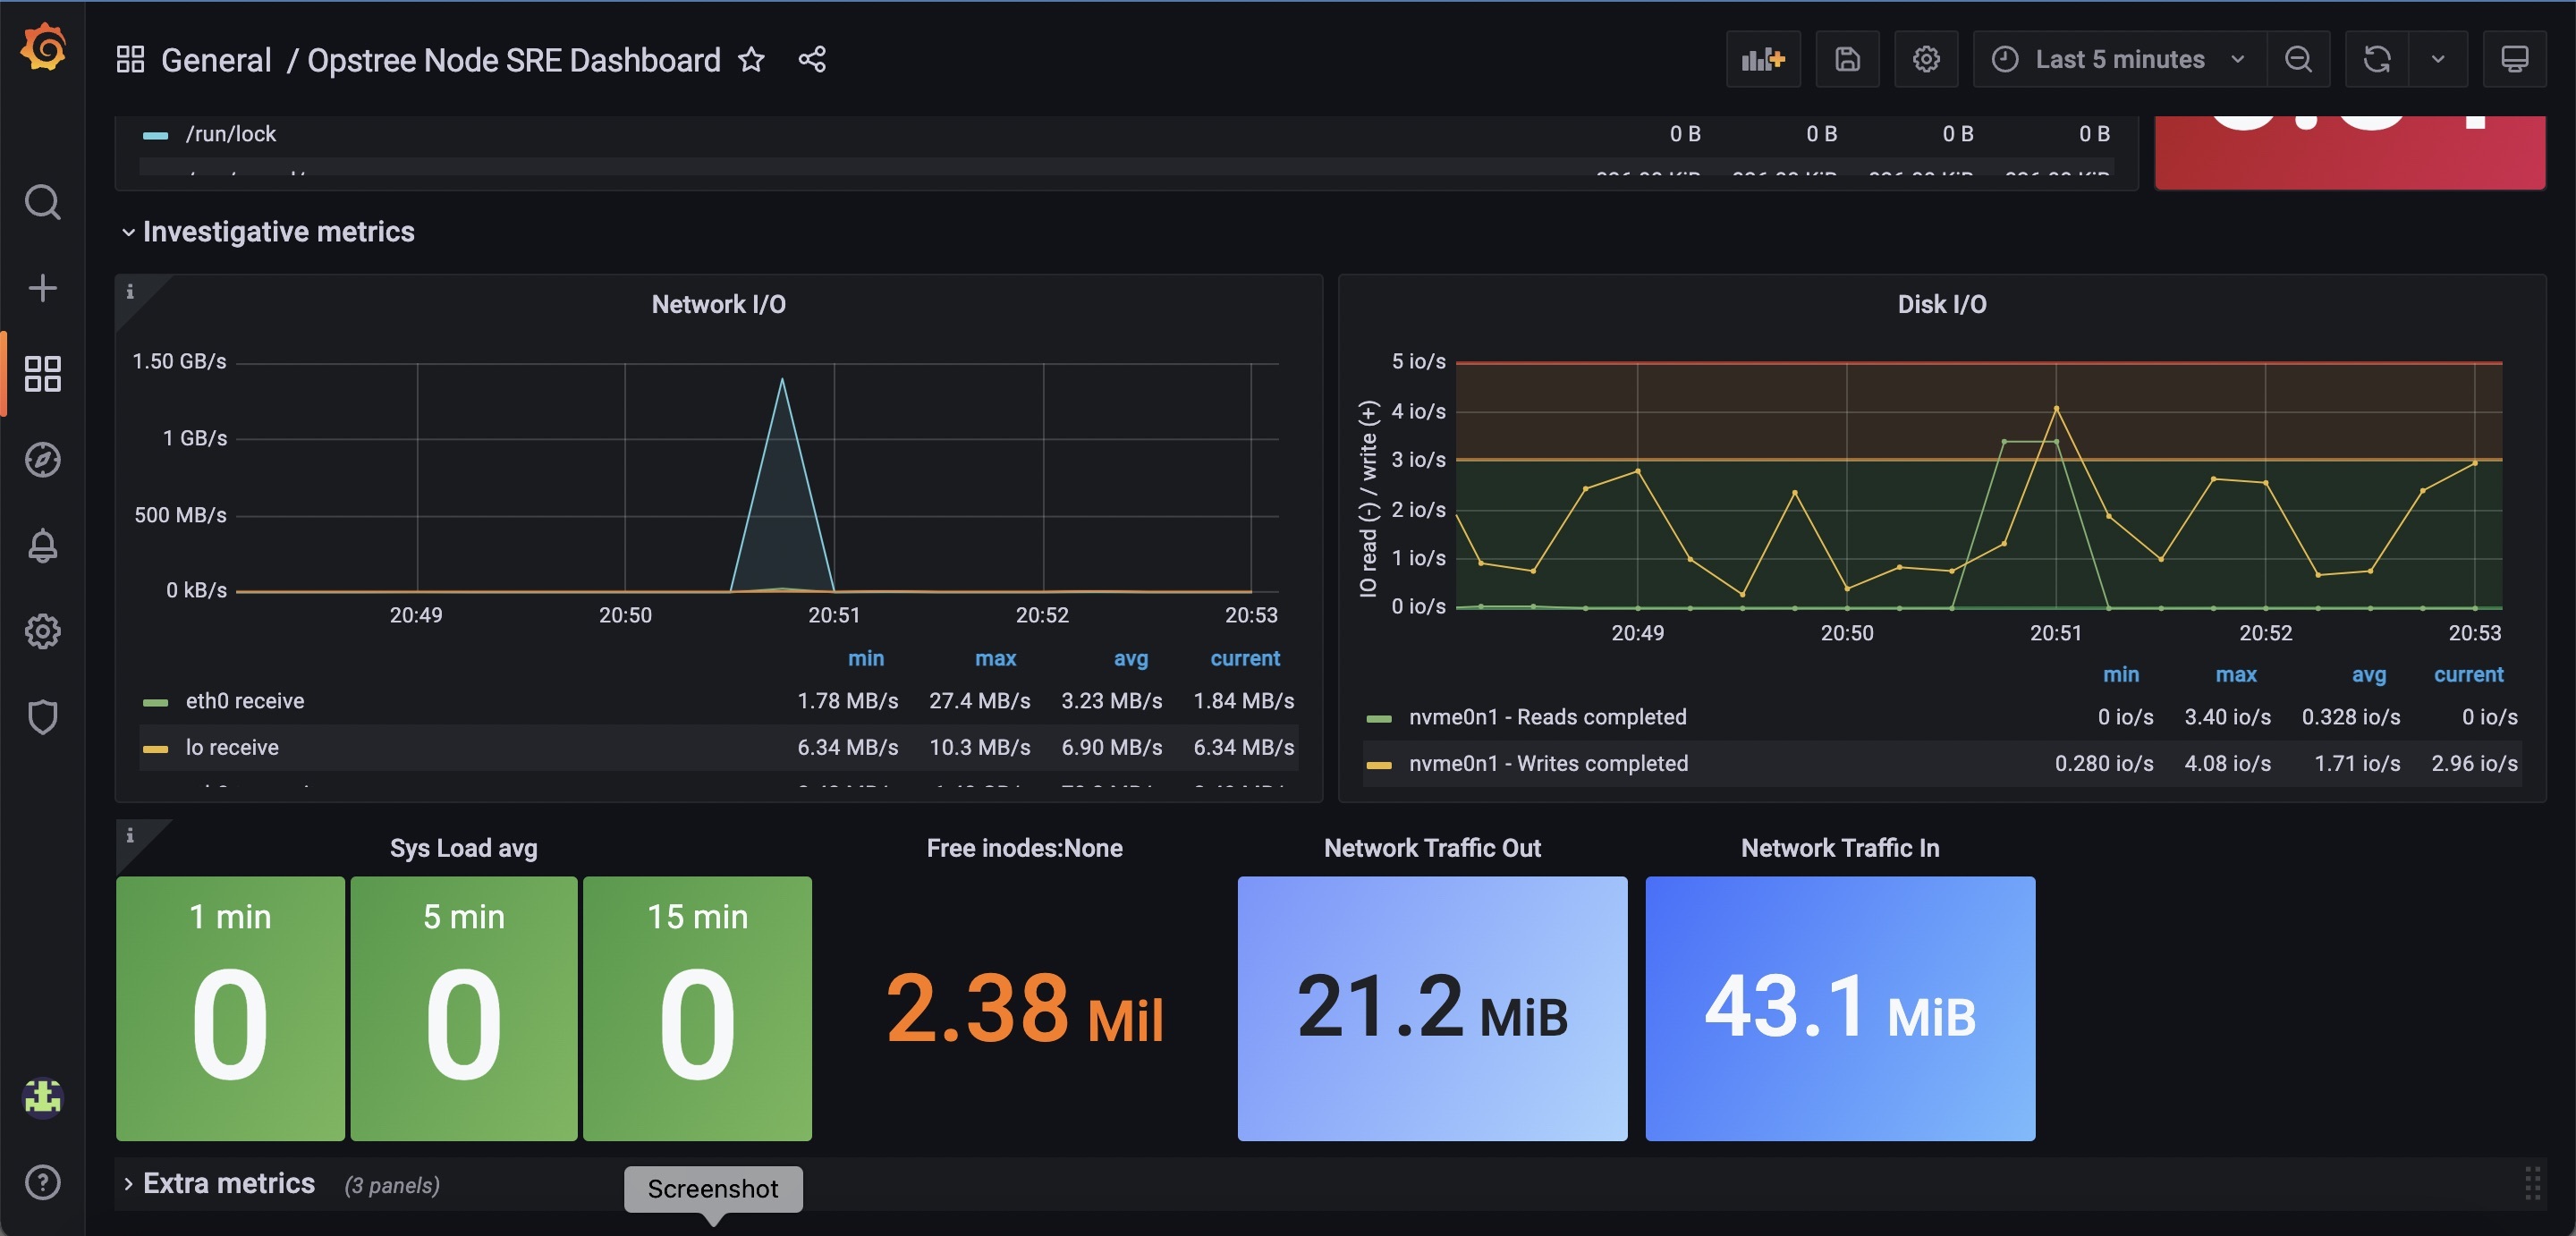
Investigative metrics:
- Free Inodes Data
- Sys Load Avg
- Network Traffic I/O
- Disk I/O
Contributor Information
Data source config
Collector type:
Collector plugins:
Collector config:
Revisions
Upload an updated version of an exported dashboard.json file from Grafana
| Revision | Description | Created | |
|---|---|---|---|
| Download |