Infra / Nexus
Nexus Dashboard by KL
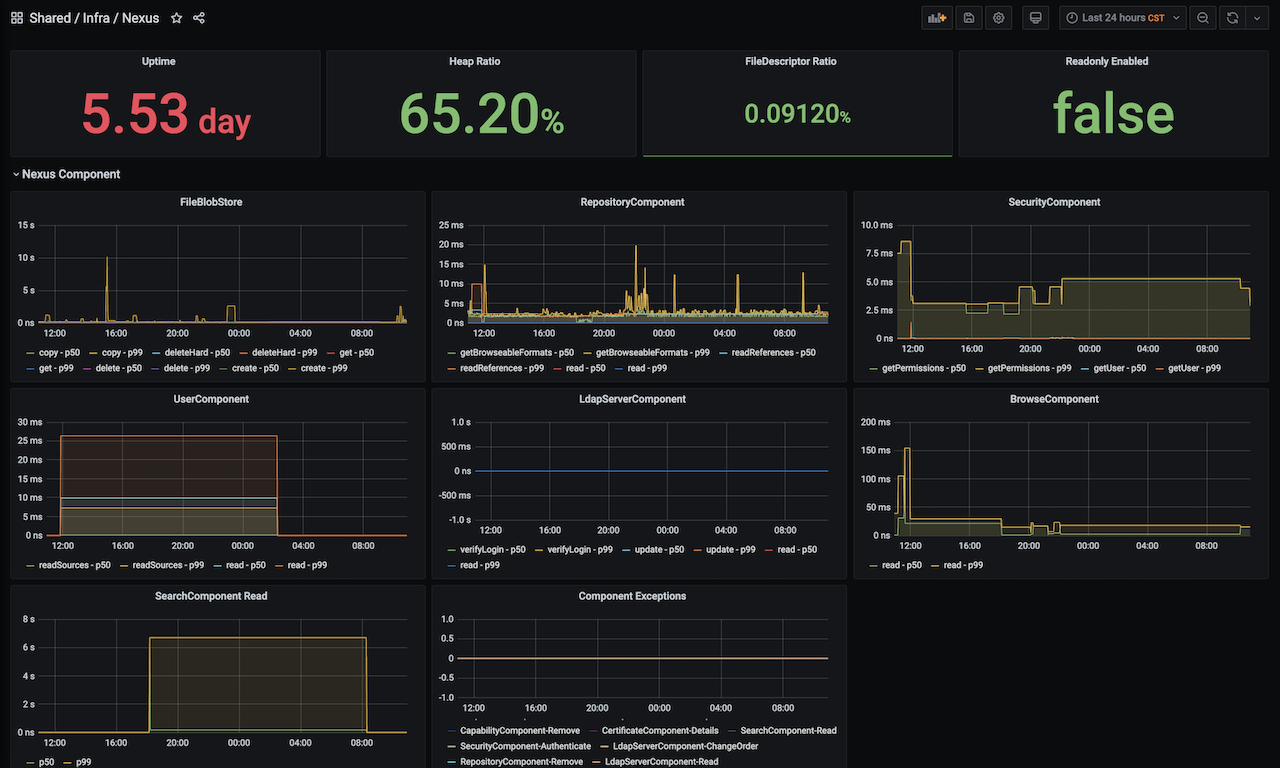
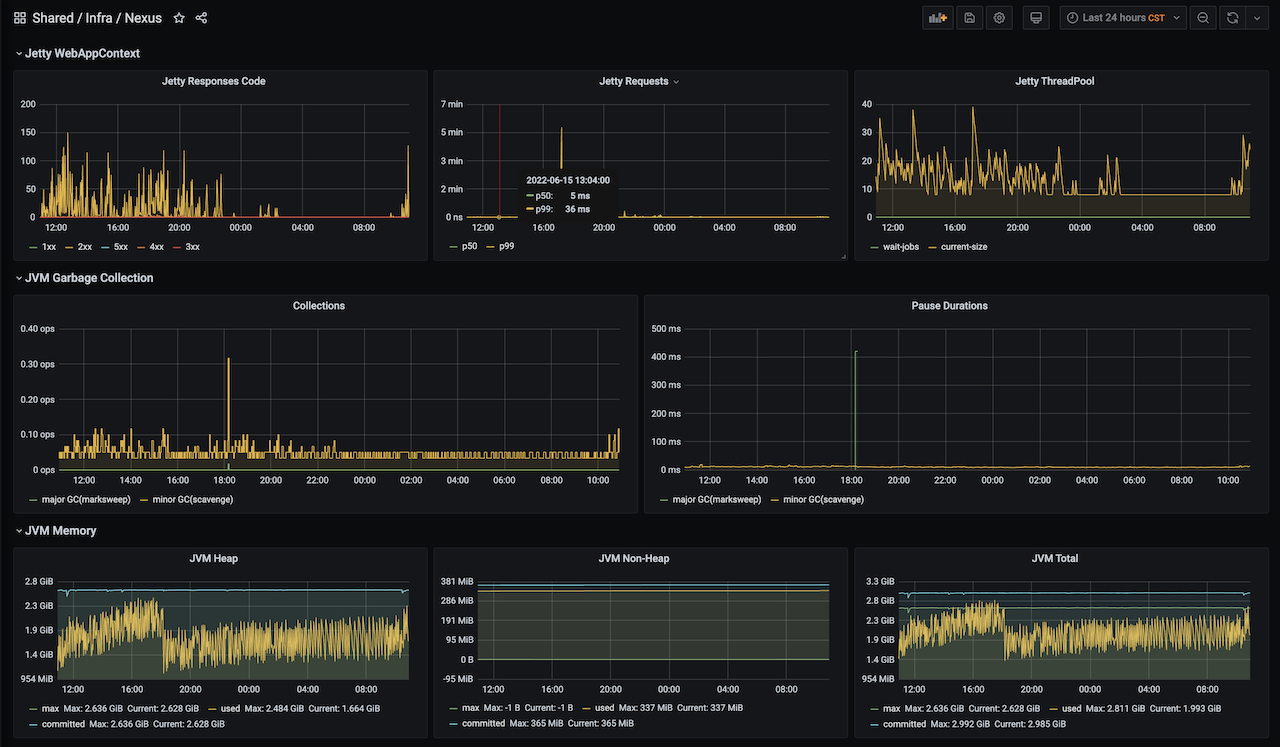
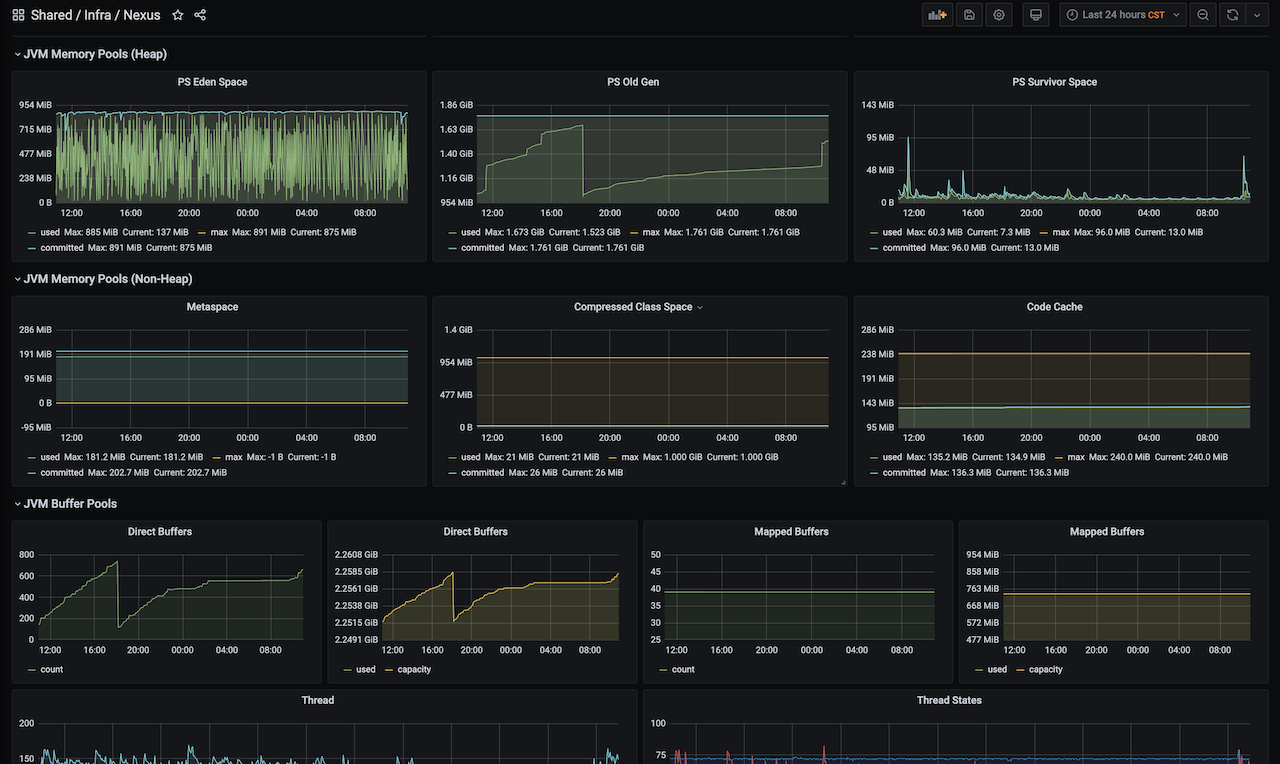
Based on Nexus (http://localhost:8081/service/metrics/prometheus). The dashboard displays the following metrics.
- Nexus component runtime, execution elapsed time, exceptions, etc.
- Jetty runtime, requests, responses, threads.
- JVM runtime.
Metrics Export Ref:https://help.sonatype.com/repomanager3/nexus-repository-administration/support-features#SupportFeatures-Prometheus
- If you have any problems using this dashboard you can find me at https://github.com/klboke
Data source config
Collector config:
Upload an updated version of an exported dashboard.json file from Grafana
| Revision | Description | Created | |
|---|---|---|---|
| Download |


