Tarantool Data Grid dashboard
Dashboard for Tarantool Data Grid ver. 2 application monitoring, based on grafonnet library.
About project
This dashboard is based on grafonnet library. Sources are available in project's GitHub page.
Configuration
The dashboard is designed to work with TDG + Telegraf + InfluxDB + Grafana cluster.
TDG configuration
The dashboard is designed to work with Tarantool Data Grid (ver. 2) cluster.
TDG must be configured to have a json metrics endpoint for Telegraf (refer to cartridge.roles.metrics role page for instructions).
Telegraf configuration
Telegraf must be configured to have data_format set as "json" and fieldpass list set as ["value"]; tag_keys list must contain "metric_name", "label_pairs_alias", "label_pairs_quantile", "label_pairs_path", "label_pairs_method", "label_pairs_status", "label_pairs_operation", "label_pairs_level", "label_pairs_id", "label_pairs_engine", "label_pairs_name", "label_pairs_index_name", "label_pairs_delta", "label_pairs_stream", "label_pairs_type", "label_pairs_connector_name", "label_pairs_broker_name", "label_pairs_topic", "label_pairs_request", "label_pairs_kind", "label_pairs_thread_name", "label_pairs_type_name", "label_pairs_operation_name", "label_pairs_schema", "label_pairs_entity", "label_pairs_status_code" values. You can also check out example config on GitHub.
Dashboard
Metrics used in dashboard are based on Tarantool metrics module and TDG metrics. Time series are grouped by alias parameter, so you can use this dashboard to monitor a cluster of Tarantool instances.
Dashboard contains the following sections:
- Cluster overview
- Replication overview
- Tarantool network activity
- Tarantool memtx allocation overview
- Tarantool MVCC overview
- Tarantool vinyl statistics
- Tarantool CPU statistics
- Tarantool runtime overview
- Tarantool LuaJit statistics
- Tarantool operations statistics
- TDG Kafka common statistics
- TDG Kafka brokers statistics
- TDG Kafka topics statistics
- TDG Kafka consumer statistics
- TDG Kafka producer statistics
- TDG expirationd statistics
- TDG tuples statistics
- TDG file connectors statistics
- TDG GraphQL requests
- TDG IProto requests
- TDG REST API requests
- TDG tasks statistics
Cluster overview
Contains panels on Cartridge issues count, read only status and switchover triggers, election info.
Replication overview
Contains info about replication lag and status, clock delta and synchronous queue statistics.
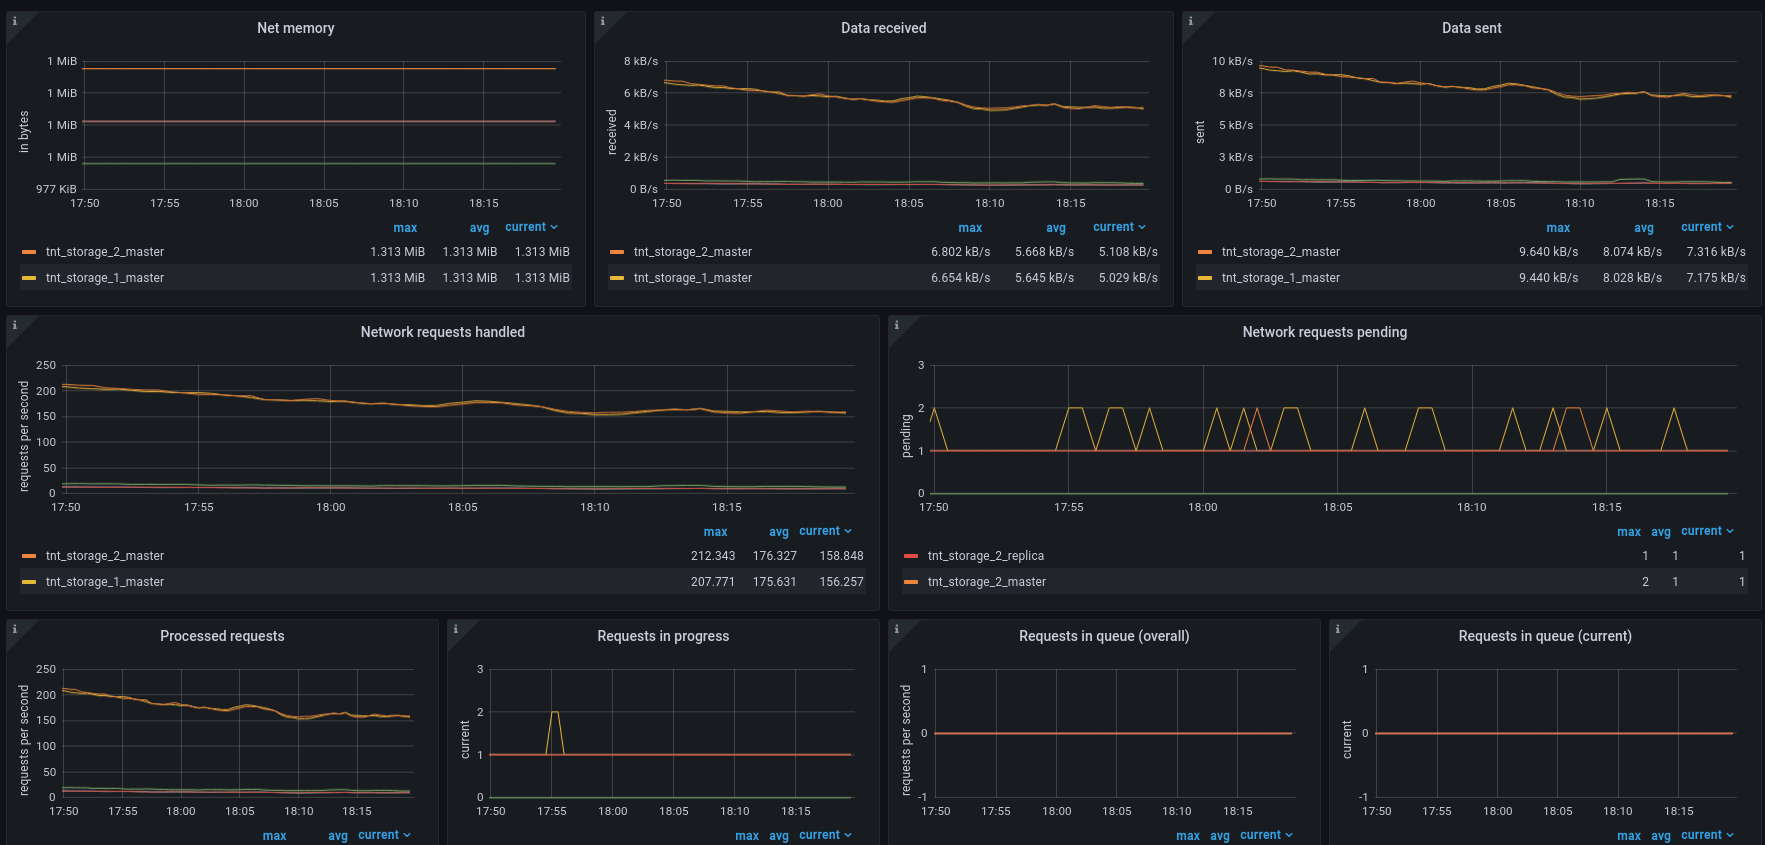
Tarantool network activity
Overview of instances network activity. Displays input and output data load, as well as network connections, detailed requests stats and memory consumption.
Tarantool memtx allocation overview
Overview of Tarantool memtx memory allocation (tuples and indexes). Contains short instruction on memory allocation monitoring. You can read more about slab here.
Tarantool MVCC overview
Contains statistics of Tarantool memtx engine transactions manager.
Tarantool vinyl statistics
Overview of Tarantool vinyl memory and disk allocation, vinyl scheduler process and transaction statistics. You can read more about vinyl engine here.
Tarantool CPU statistics
Contains CPU process time statistics for each instance and separate thread load.
Tarantool runtime overview
Metrics related to runtime. Contains Lua and transaction memory panels, fiber statistics panels and event loop panel.
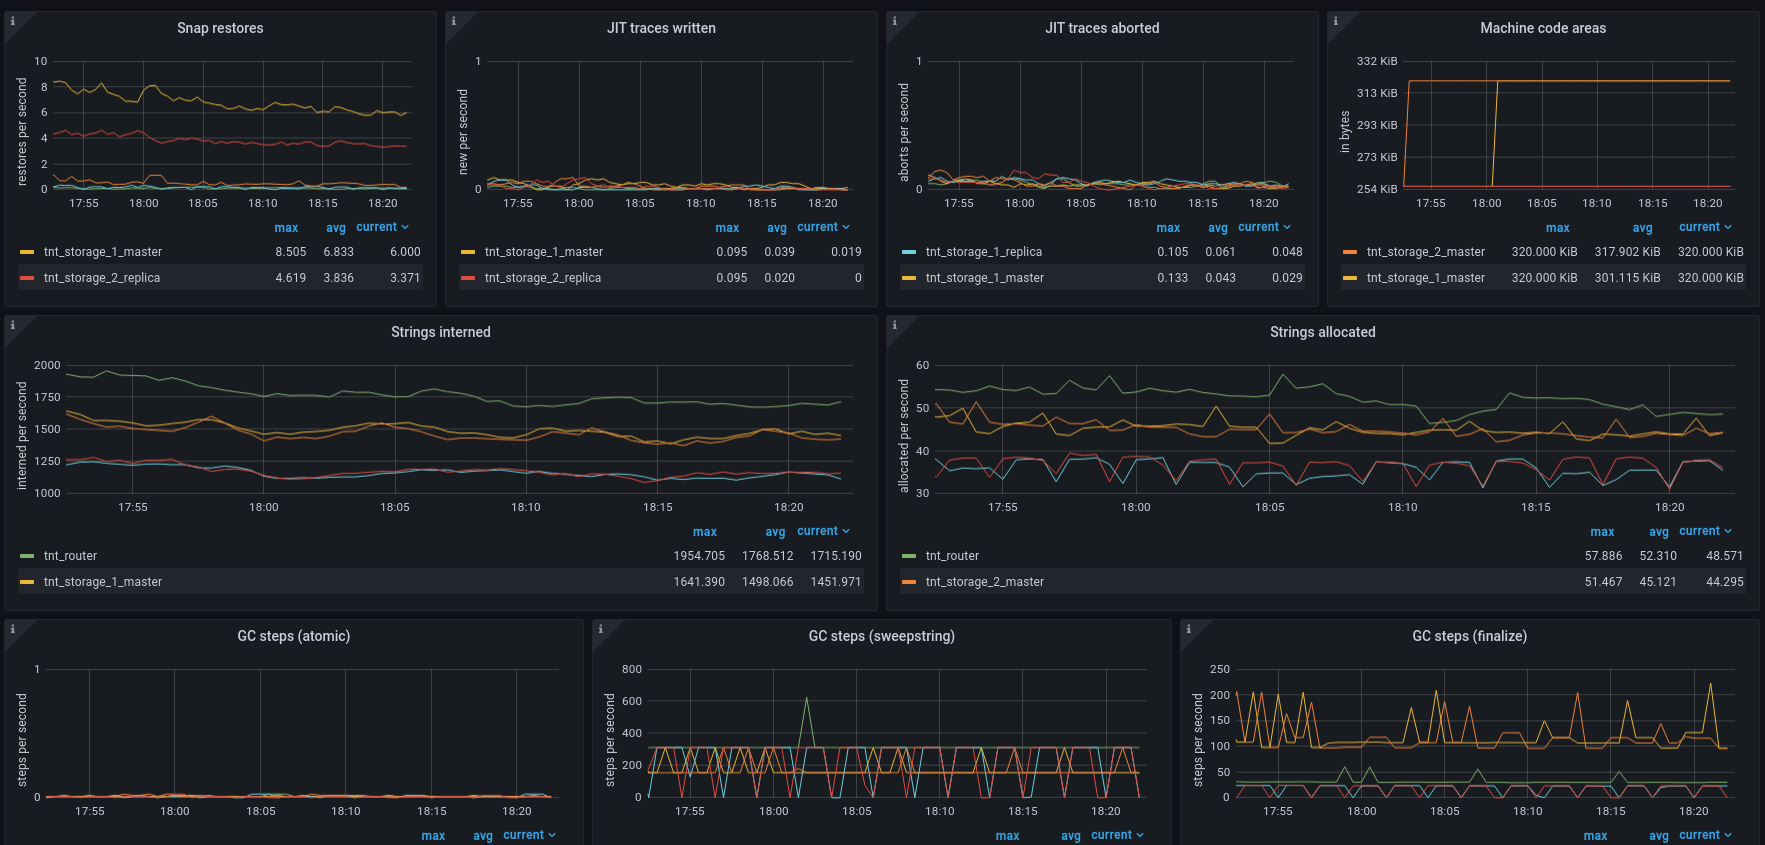
Tarantool LuaJit statistics
Detailed Lua runtime overview. Contains panels about objects allocation and garbage collect, memory consumption and LuaJit traces info.
Tarantool operations statistics
Overview of operations on Tarantool spaces (select, update, etc.) aggregated over all Tarantool spaces, as well as other operations activity (eval, call, auth, errors and SQL calls).
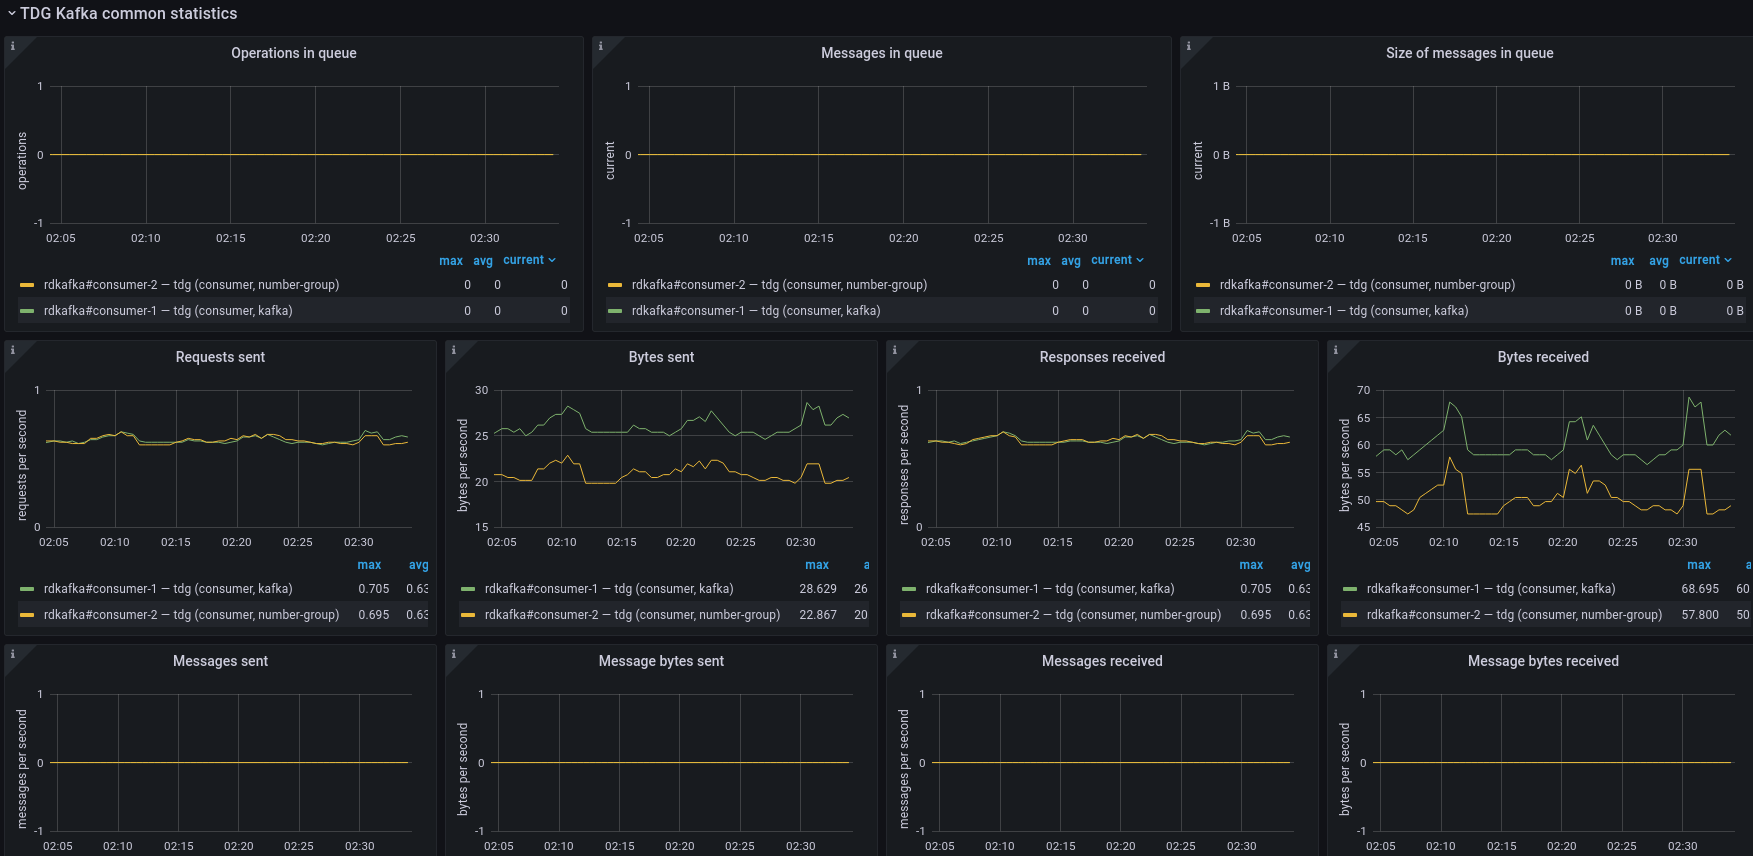
TDG Kafka common statistics
TDG Kafka connector common statistics. See librdkafka "top-level" statistics section for details.
TDG Kafka brokers statistics
TDG Kafka connector brokers statistics. See librdkafka "brokers" statistics section for details.
TDG Kafka topics statistics
TDG Kafka connector topics statistics. See librdkafka "topics" statistics section for details.
TDG Kafka consumer statistics
TDG Kafka connector consumer statistics. See librdkafka "cgrp" statistics section for details.
TDG Kafka producer statistics
TDG Kafka connector producer statistics. See librdkafka "eos" statistics section for details.
TDG expirationd statistics
TDG expirationd module statistics.
TDG tuples statistics
Tuple find operations statistics.
TDG file connectors statistics
File connectors overall and current process statistics.
TDG GraphQL requests
TDG API GraphQL requests statistics.
TDG IProto requests
TDG API IProto net.box calls statistics.
TDG REST API requests
TDG REST API requests statistics.
TDG tasks statistics
TDG tasks, jobs and system tasks statistics.
Contributing
Project is open-sourced, so you can freely file an issue with suggestion or bug report to our GitHub page.
Data source config
Collector config:
Upload an updated version of an exported dashboard.json file from Grafana
| Revision | Description | Created | |
|---|---|---|---|
| Download |