
Amazon MQ (ActiveMQ)
Amazon MQ metrics for Active MQ
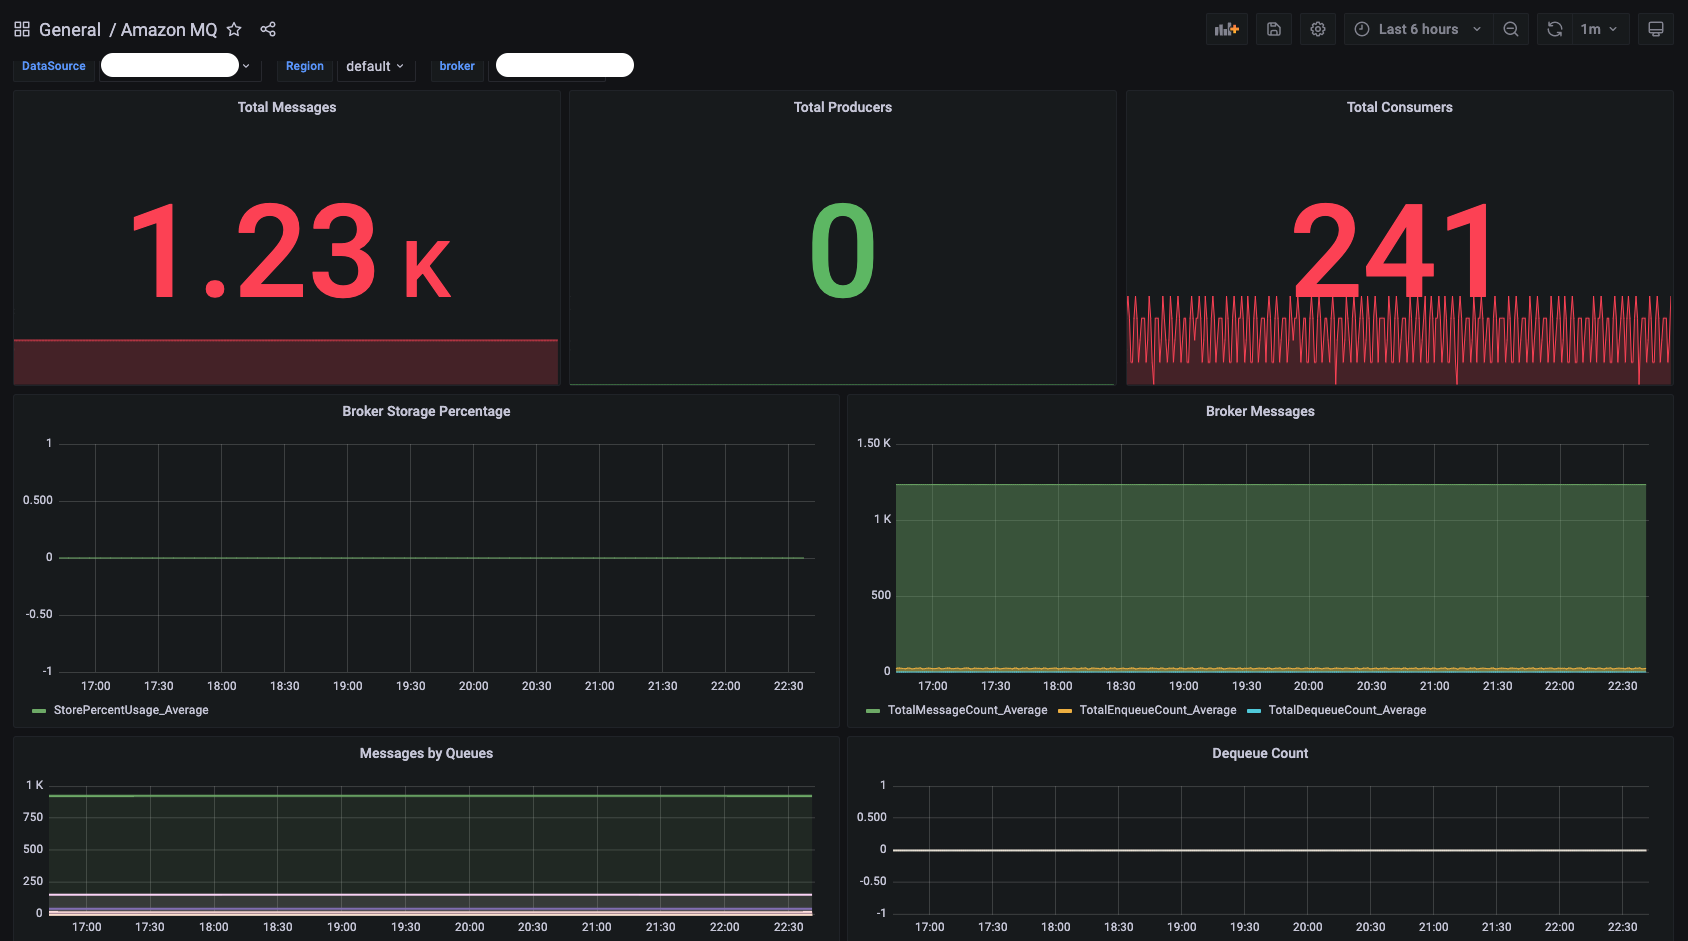
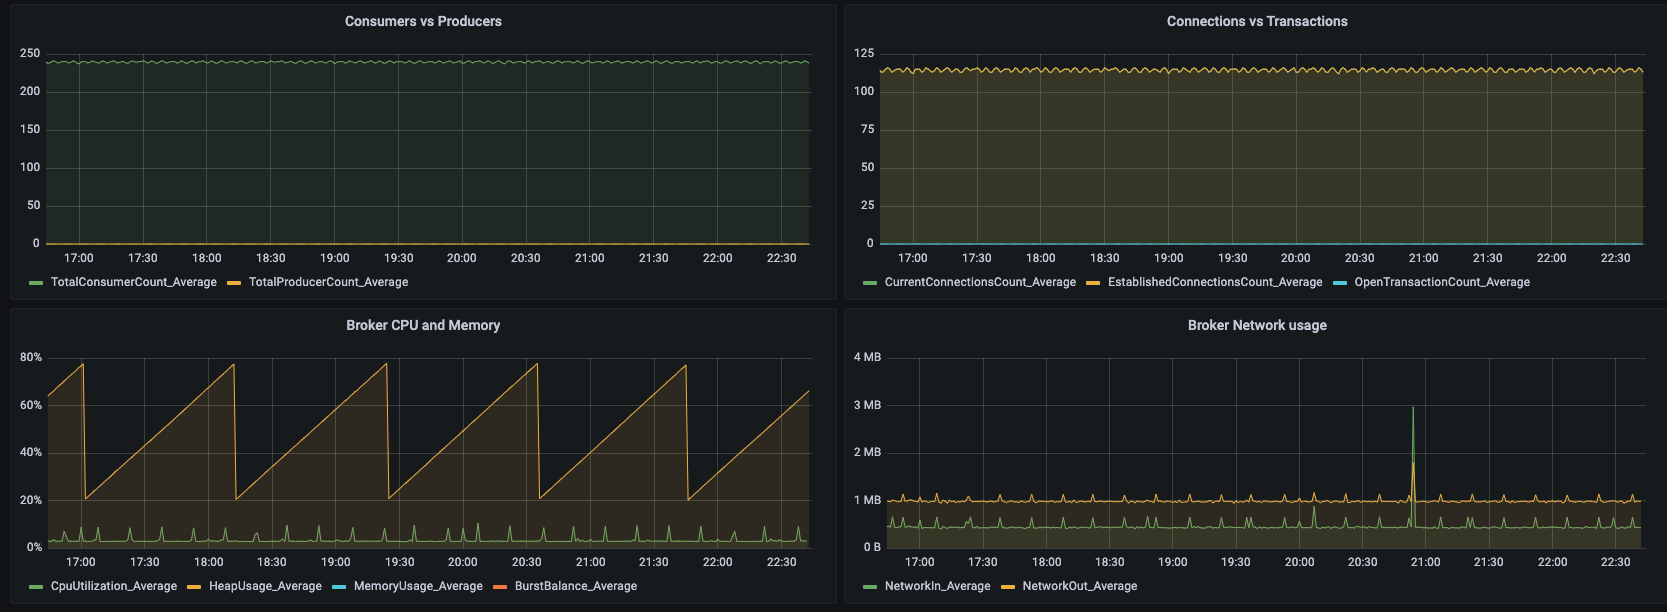
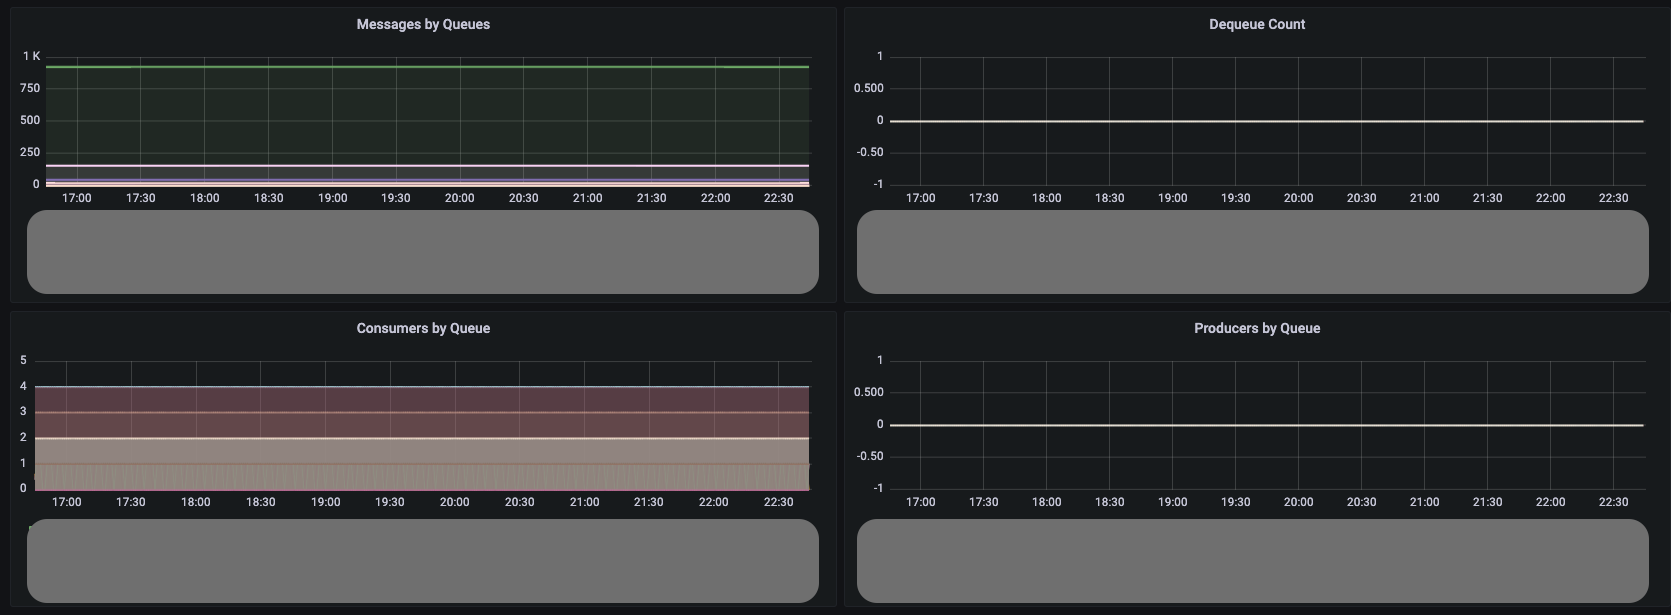
This dashboard shows the key broker metrics from CloudWatch for Active MQ.
Pre-requisites :
- Text panel
- Stats Panel
- Graph Panel
- Permission to read CloudWatch metrics from AWS
Data source config
Collector type:
Collector plugins:
Collector config:
Revisions
Upload an updated version of an exported dashboard.json file from Grafana
| Revision | Description | Created | |
|---|---|---|---|
| Download |
Amazon Aurora
With the Grafana plugin for Amazon Aurora, you can quickly visualize and query your Amazon Aurora data from within Grafana.
Learn more