
Mimir / Reads networking
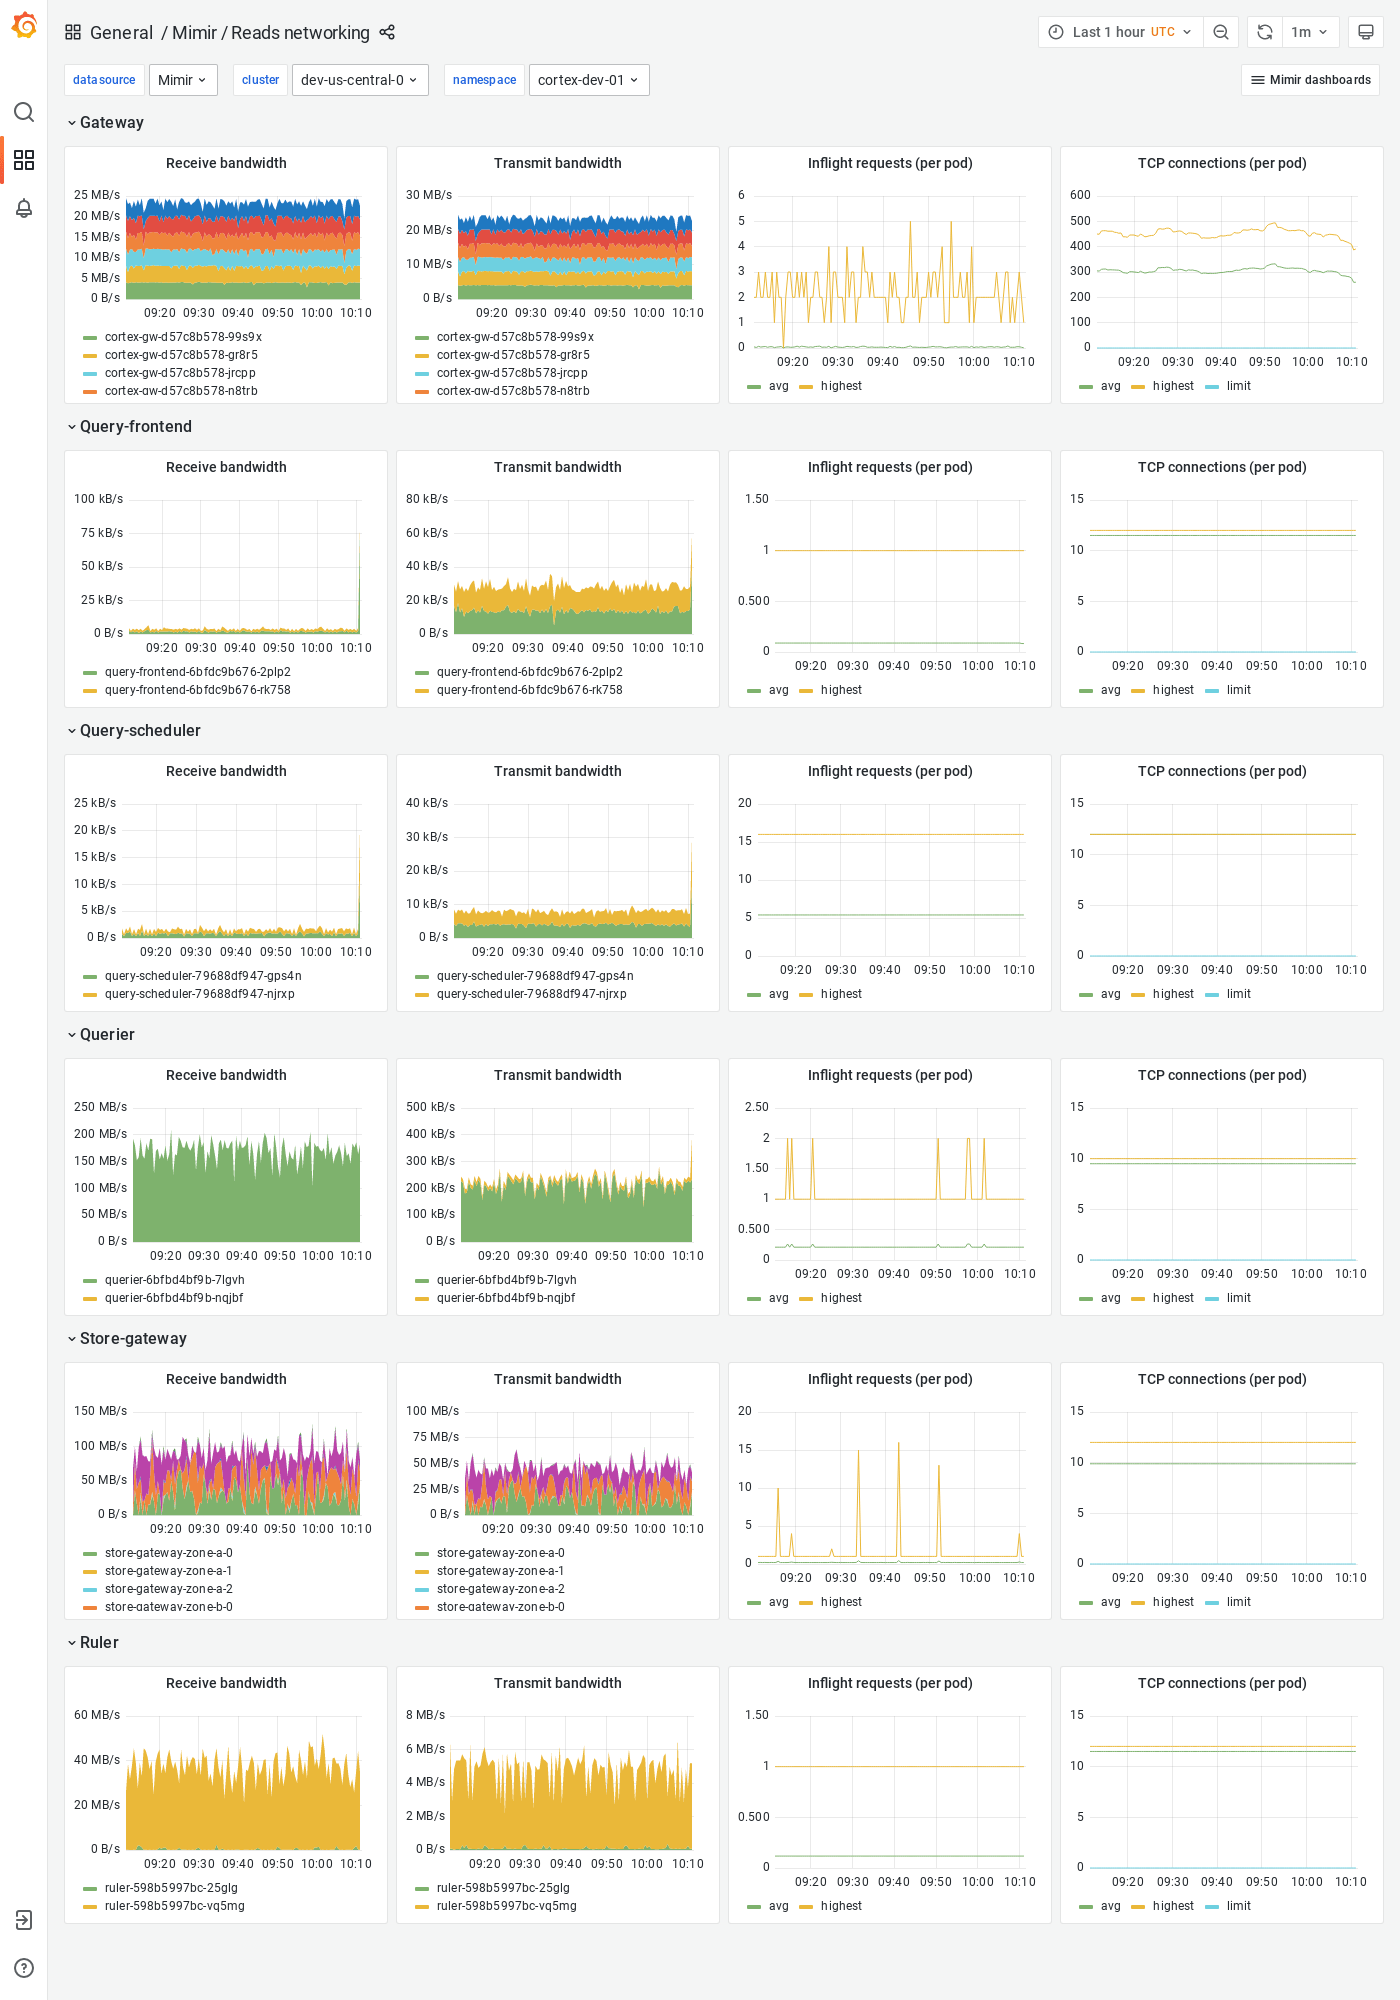
The Reads networking dashboard shows receive and transmit bandwidth, in-flight requests, and TCP connections. The dashboard isolates each service on the read path into its own section and displays the order in which a read request flows.
Grafana Mimir is an open source software project that provides a scalable long-term storage for Prometheus. For more information, visit Grafana Mimir.
Data source config
Collector type:
Collector plugins:
Collector config:
Revisions
Upload an updated version of an exported dashboard.json file from Grafana
| Revision | Description | Created | |
|---|---|---|---|
| Download |
Grafana Mimir (self-hosted)
Easily monitor your self-hosted instance of Grafana Mimir, an open source, horizontally scalable, highly available, multi-tenant TSDB, with Grafana Cloud's out-of-the-box monitoring solution.
Learn more