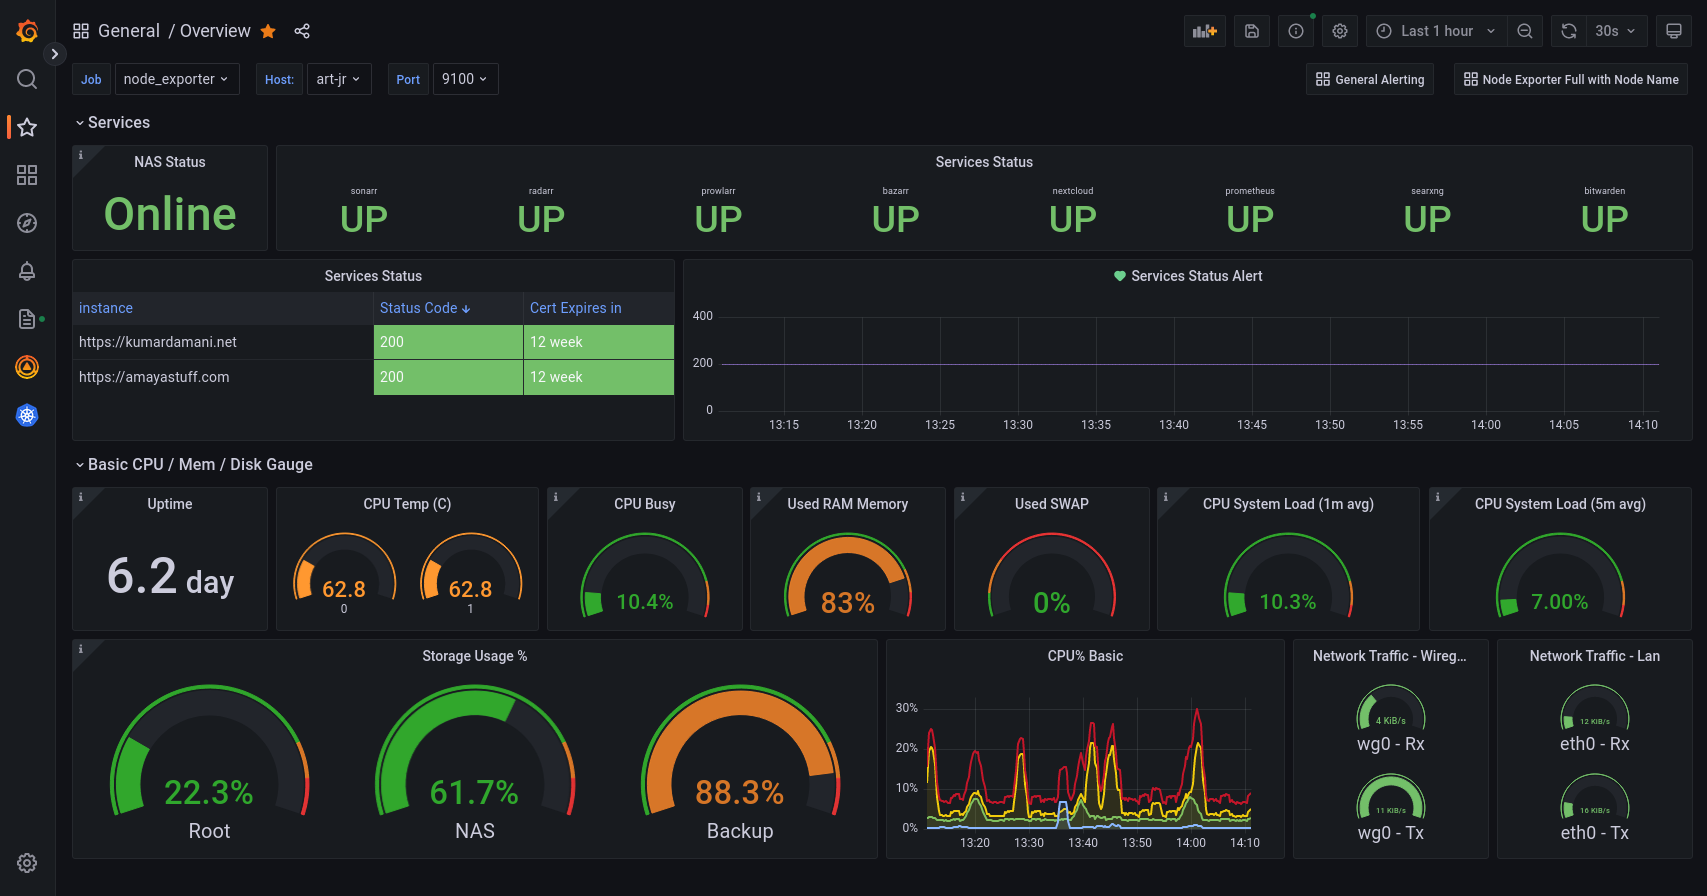
Overview
A short and sweet overview of your self-hosted services with a few panels borrowed from the popular Node Exporter dashboard.
- Monitor the status of your ZFS pool (zfs-exporter)
- Monitor the status of your service's http return codes along with their SSL expiry (blackbox exporter).
- Monitor the cpu, temp of your RPi (node_exporter)
- Monitor the overall cpu, disk, mem, network usage (node exporter).
- Alert when any of the services is down for 5 mins.
The exact configs used for each of the above can be found in my VPS gitlab repo.
Data source config
Collector config:
Upload an updated version of an exported dashboard.json file from Grafana
| Revision | Description | Created | |
|---|---|---|---|
| Download |

