Dyson Prometheus Exporter
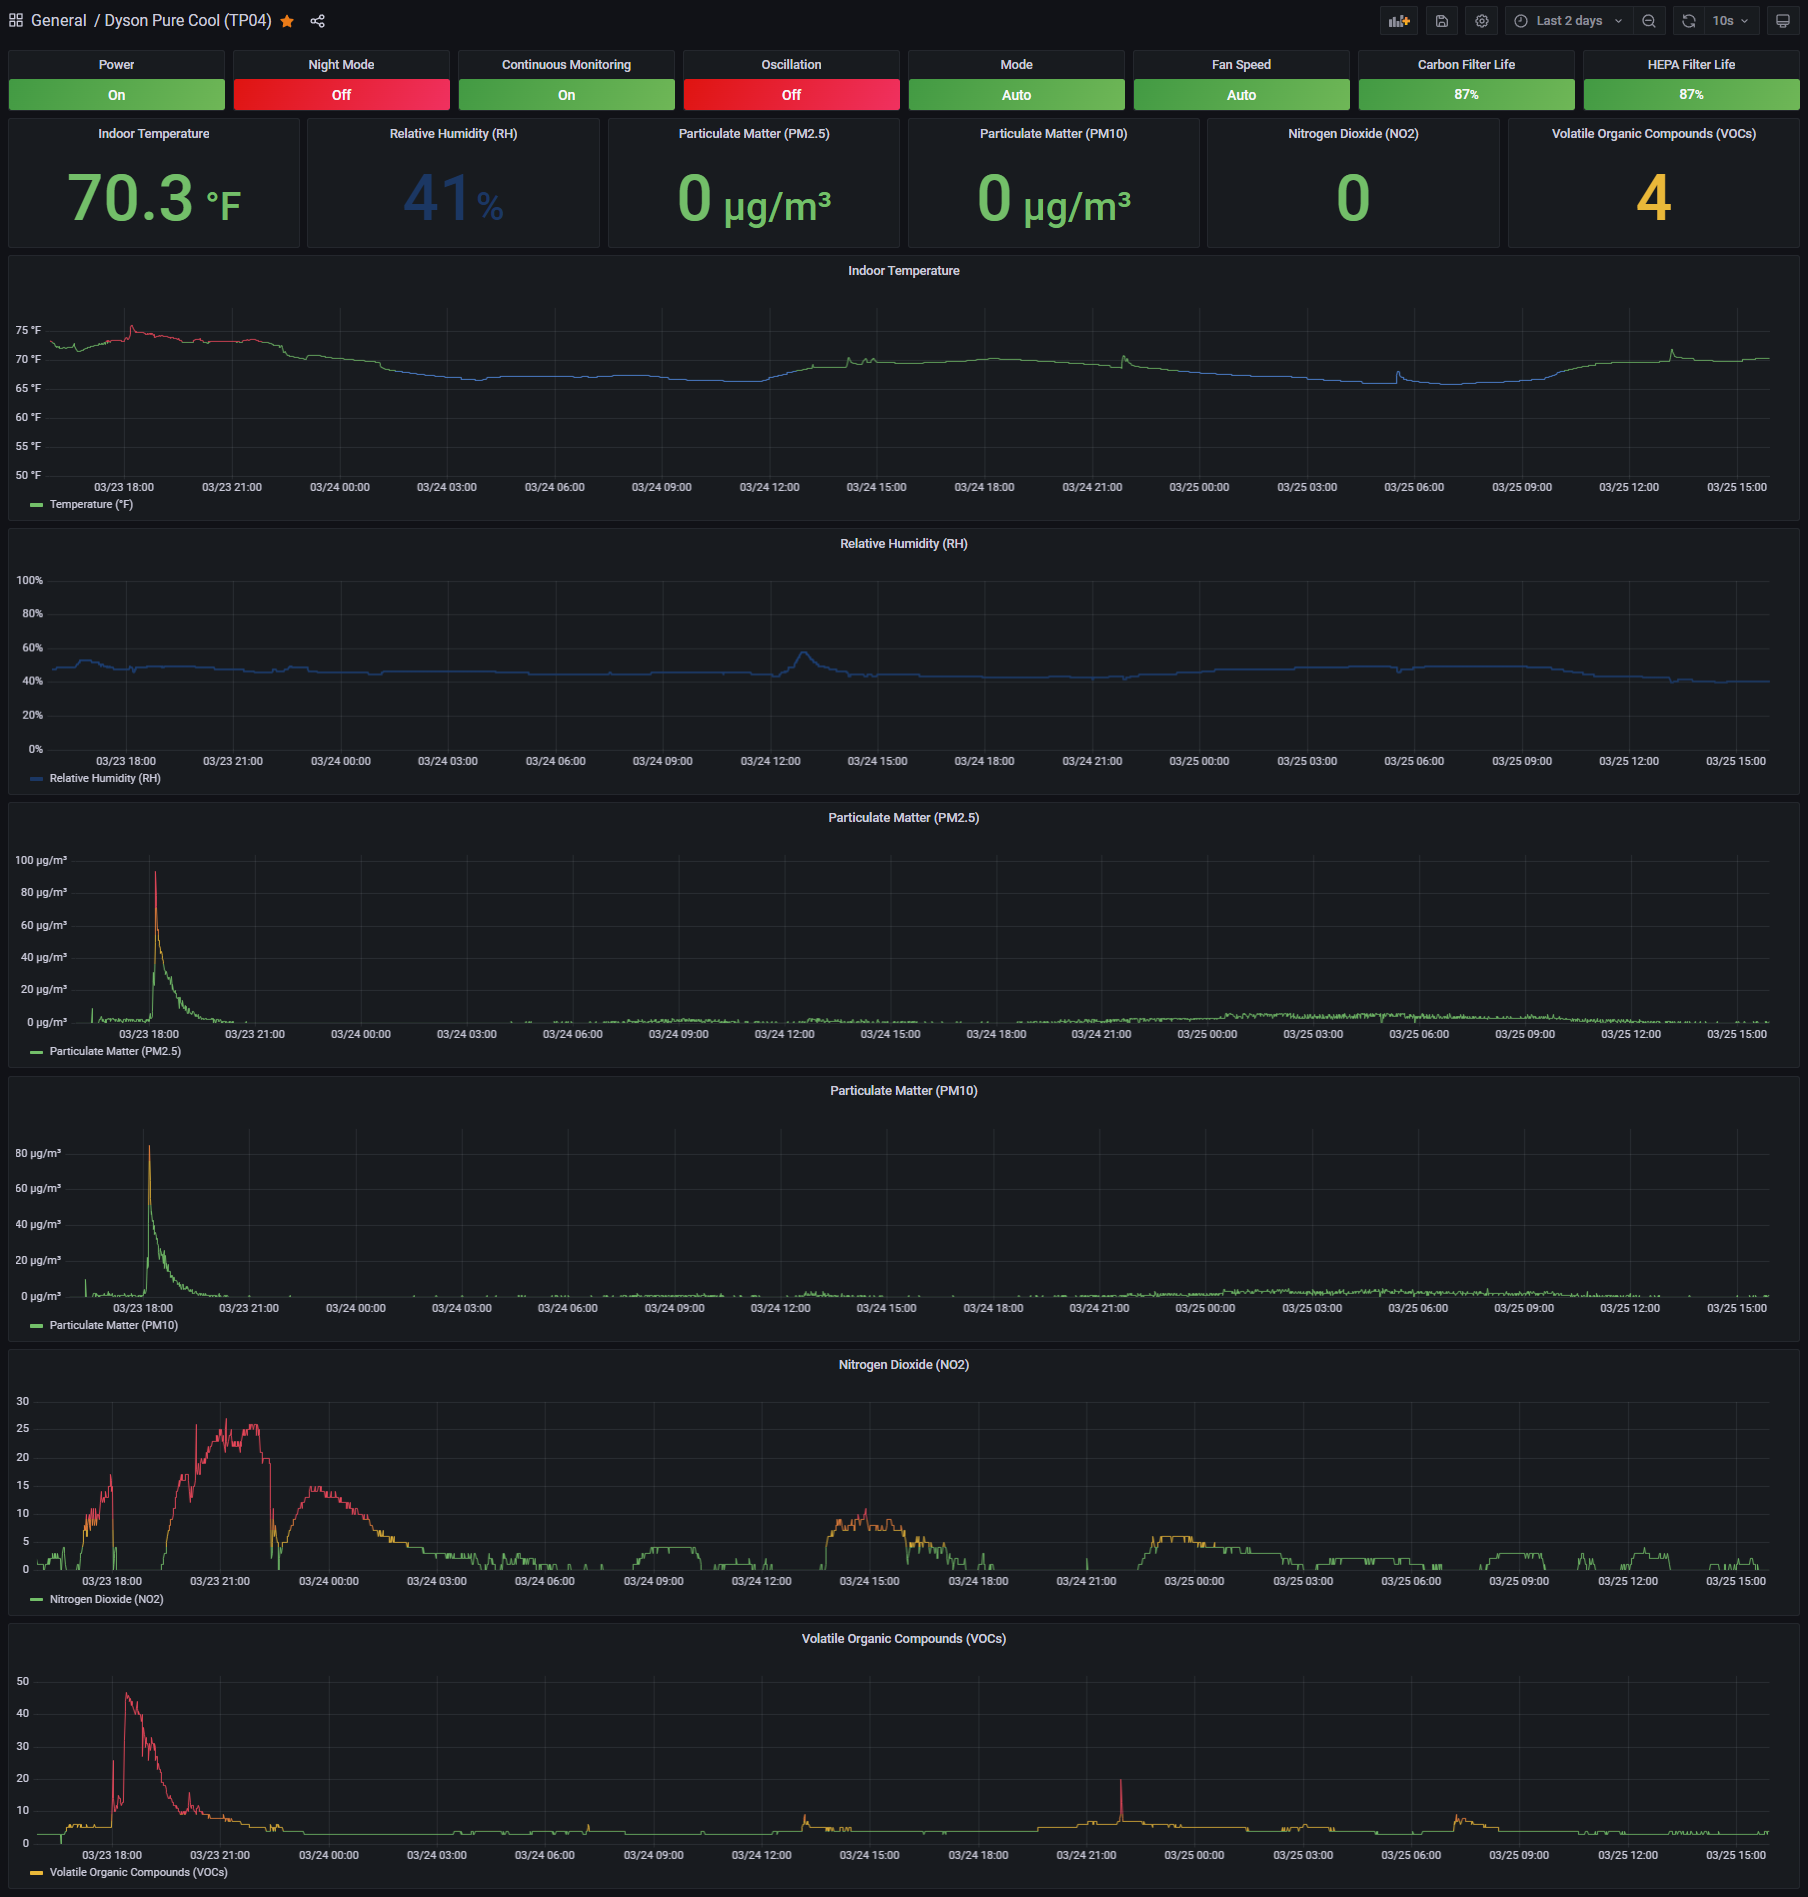
Dashboard for the Dyson Prometheus Exporter.
Prometheus Exporter for Dyson Fans
Inspired by Prometheus PVE Exporter and Dyson Graph, leveraging Libdyson for the API.
Github URL: https://github.com/zkhcohen/prometheus-dyson-exporter
Docker Hub URL: https://hub.docker.com/r/zkhcohen/prometheus-dyson-exporter
Grafana Dashboards URL: https://grafana.com/grafana/dashboards/15958
Installation Instructions:
- Clone Libdyson.
- Run get_devices.py on the CLI in order to print out credentials for your Dyson device.
- Either create a devices.ini file containing the device information (example below), or pass the variables as environment variables via a docker-compose.yml file or on the CLI.
- Install the Grafana dashboard.
Example docker-compose.yml file (using devices.ini config file):
---
version: "3.8"
services:
  prometheus-dyson-exporter:
    image: zkhcohen/prometheus-dyson-exporter:latest
    container_name: prometheus-dyson-exporter
    ports:
      - "9672:9672"
    volumes:
      - "./devices.ini:/config/devices.ini"
    environment:
      EXPORTER_PORT: "9672"
      EXPORTER_LOG_LEVEL: "INFO"
      CONFIG_PATH: "/config/devices.ini"
    restart: always
Example devices.ini config file:
[My Dyson Air Purifier]
dyson_serial = F4P-US-PT338B32
dyson_credential = ajds3AS+FPsidcQ8VxNmfJXHqFFNoBLaCaWRQTeTMnwVPhsH6rocz8UJ2puatCpszzvaQwYYL3mnsCqEgAGgc9X==
dyson_device_type = 438
dyson_ip = 10.0.10.2
Example docker-compose.yml file (using environment variables):
---
version: "3.8"
services:
  prometheus-dyson-exporter:
    image: zkhcohen/prometheus-dyson-exporter:latest
    container_name: prometheus-dyson-exporter
    ports:
      - "9672:9672"
    environment:
      EXPORTER_PORT: "9672"
      EXPORTER_LOG_LEVEL: "INFO"
      CONFIG_PATH: "/config/devices.ini"
      DYSON_SERIAL: "F4P-US-PT338B32"
      DYSON_CREDENTIAL: "ajds3AS+FPsidcQ8VxNmfJXHqFFNoBLaCaWRQTeTMnwVPhsH6rocz8UJ2puatCpszzvaQwYYL3mnsCqEgAGgc9X=="
      DYSON_DEVICE_TYPE: "438"
      DYSON_IP: "10.0.10.2"
    restart: always
Data source config
Collector config:
Upload an updated version of an exported dashboard.json file from Grafana
| Revision | Description | Created | |
|---|---|---|---|
| Download |
Metrics Endpoint (Prometheus)
Easily monitor any Prometheus-compatible and publicly accessible metrics URL with Grafana Cloud's out-of-the-box monitoring solution.
Learn more
