
prometheus alert history
Dashboard for alertsnitch。https://gitlab.com/yakshaving.art/alertsnitch
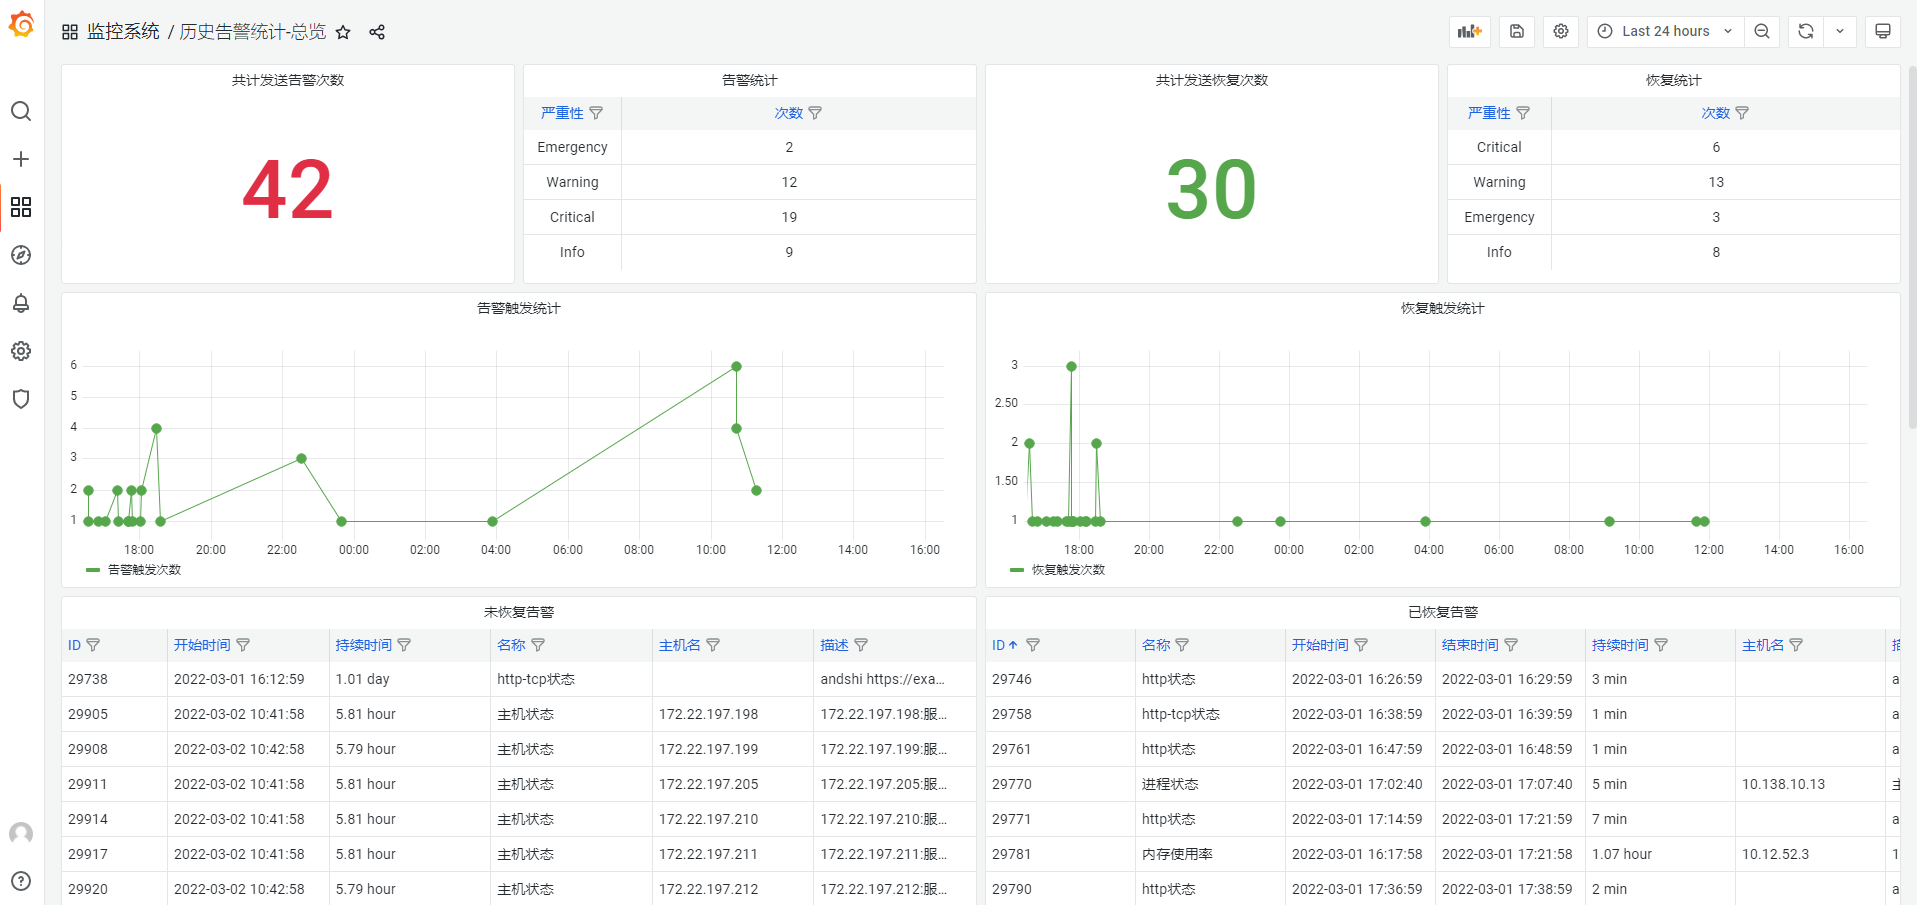
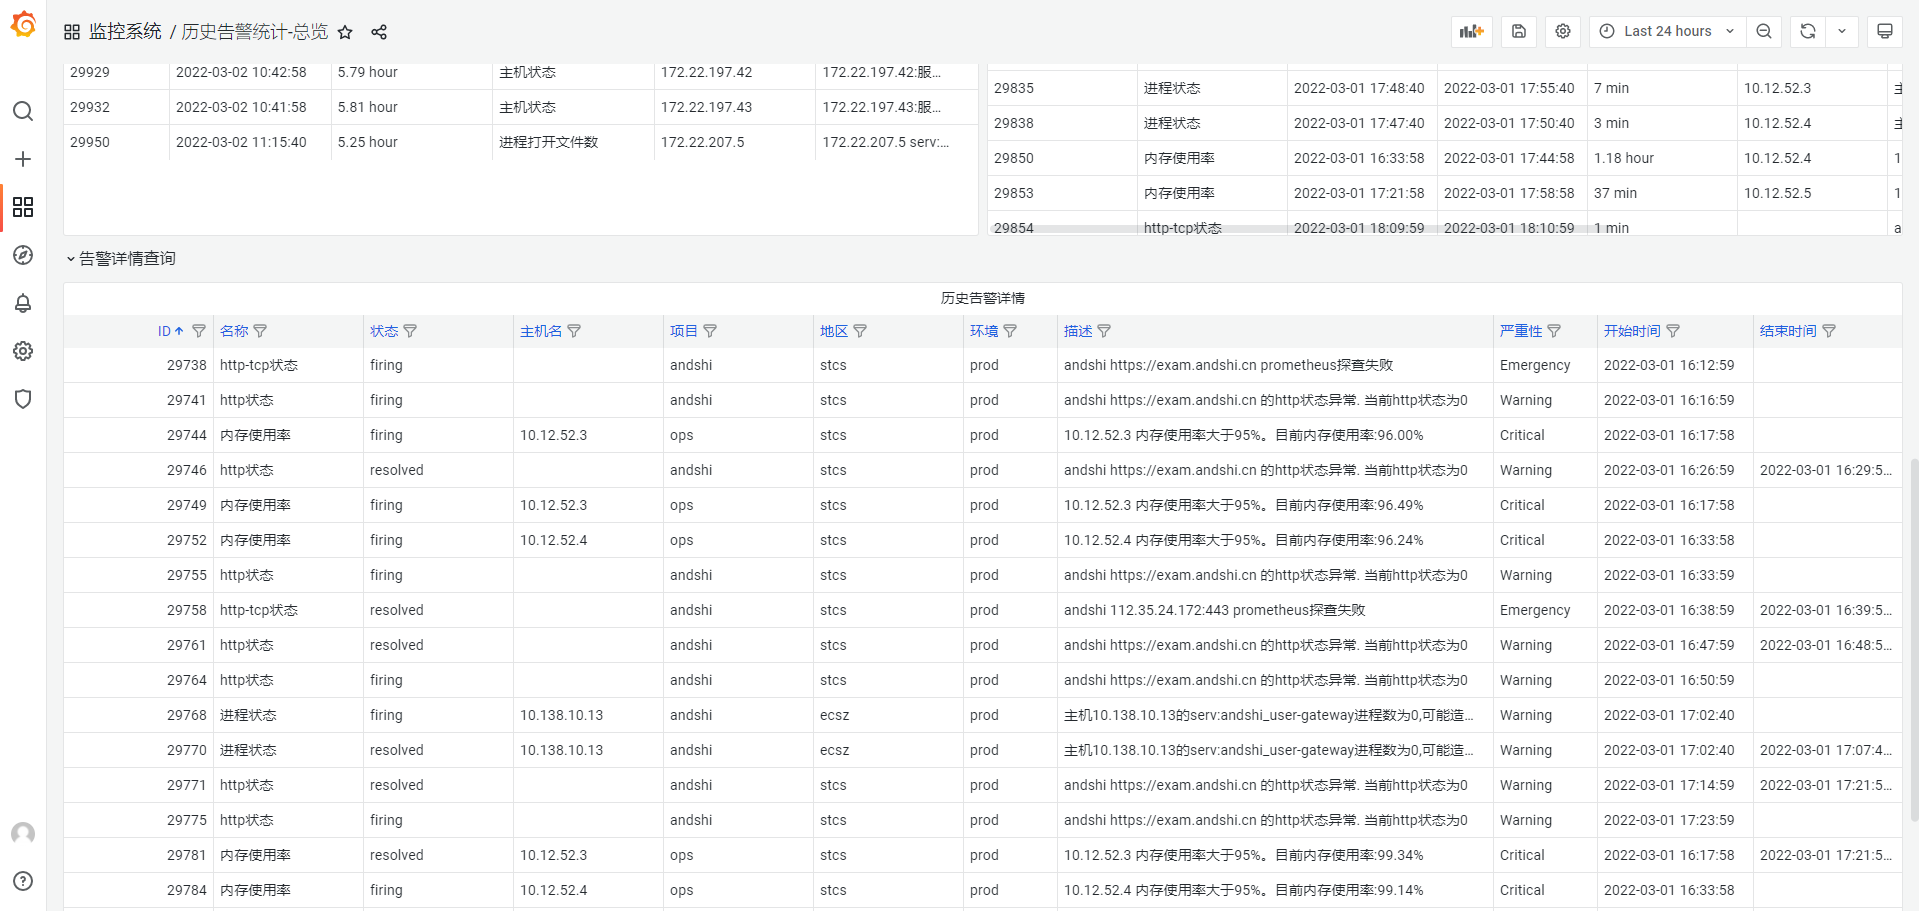
The prometheus alert history dashboard uses the mysql data source to create a Grafana dashboard with the stat, table and timeseries panels.
Data source config
Collector type:
Collector plugins:
Collector config:
Revisions
Upload an updated version of an exported dashboard.json file from Grafana
| Revision | Description | Created | |
|---|---|---|---|
| Download |
Metrics Endpoint (Prometheus)
Easily monitor any Prometheus-compatible and publicly accessible metrics URL with Grafana Cloud's out-of-the-box monitoring solution.
Learn more