Akka.NET Cluster + Phobos Metrics
System-wide Akka.NET metrics used for profiling Akka.NET performance. Gathered via Phobos and OpenTelemetry. Built for Phobos 2.x.
Akka.NET Cluster Overview Dashboard
Overview
This Akka.NET Cluster Overview Dashboard provides comprehensive monitoring and observability for Akka.NET clusters running with Phobos 2.x and OpenTelemetry. Monitor cluster health, actor performance, message throughput, and system reliability in real-time.
🚀 Features
- Cluster Health Monitoring: Track node status, membership changes, and network partitions
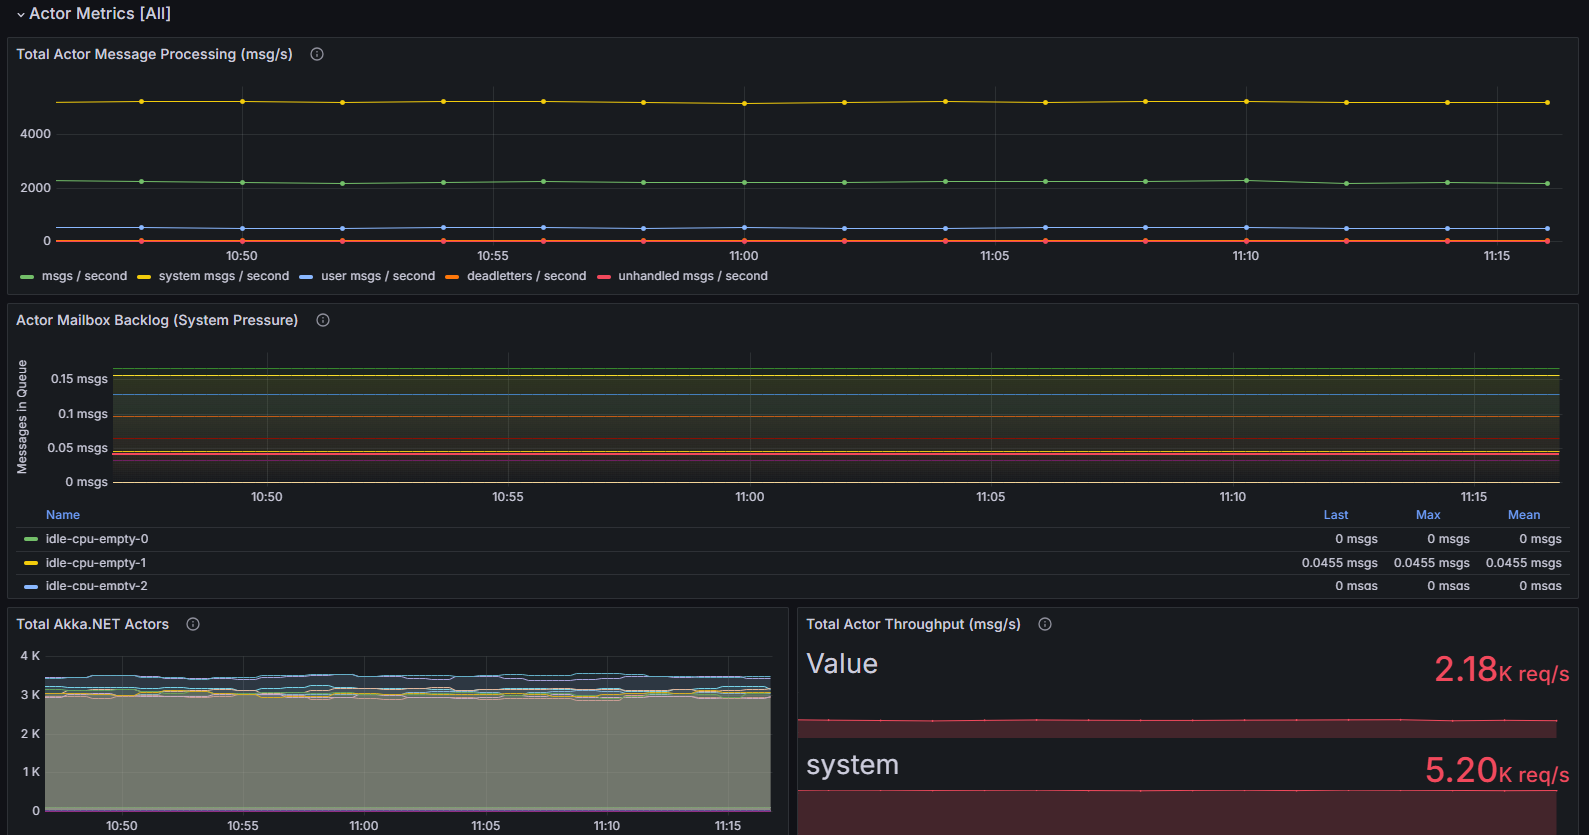
- Actor System Metrics: Monitor live actors, message processing rates, and mailbox backlogs
- Performance Analytics: Analyze message throughput by type and actor category
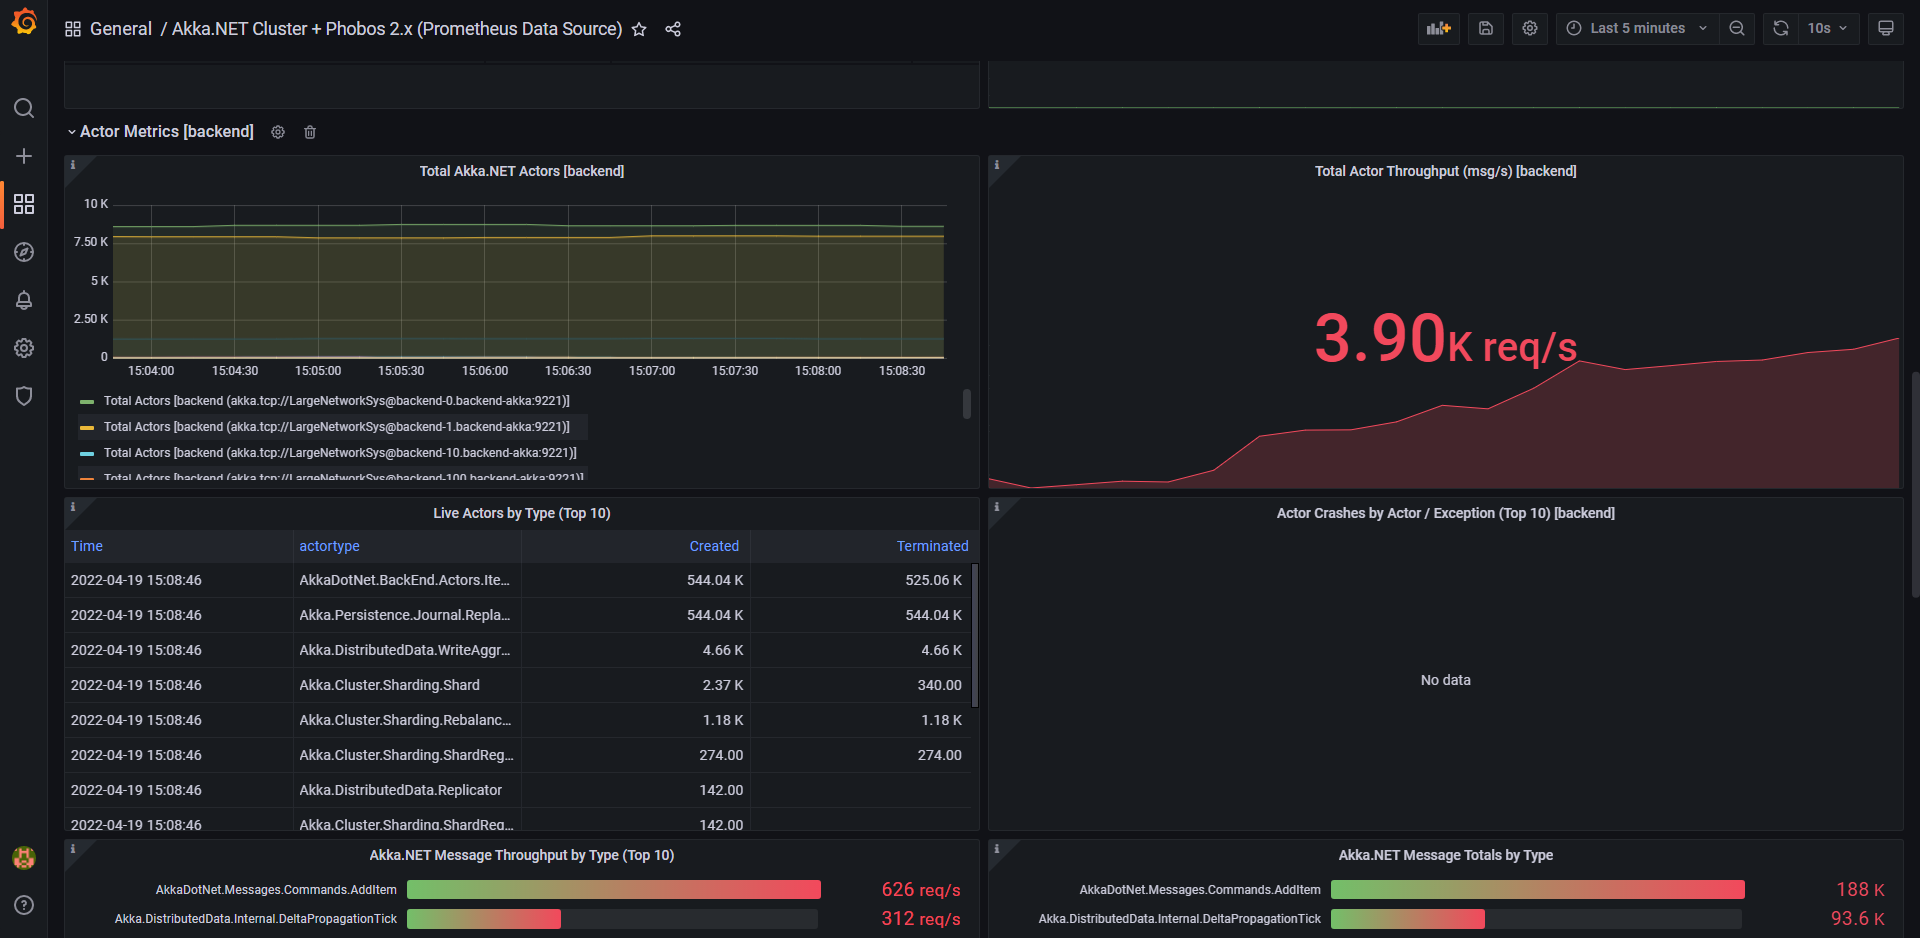
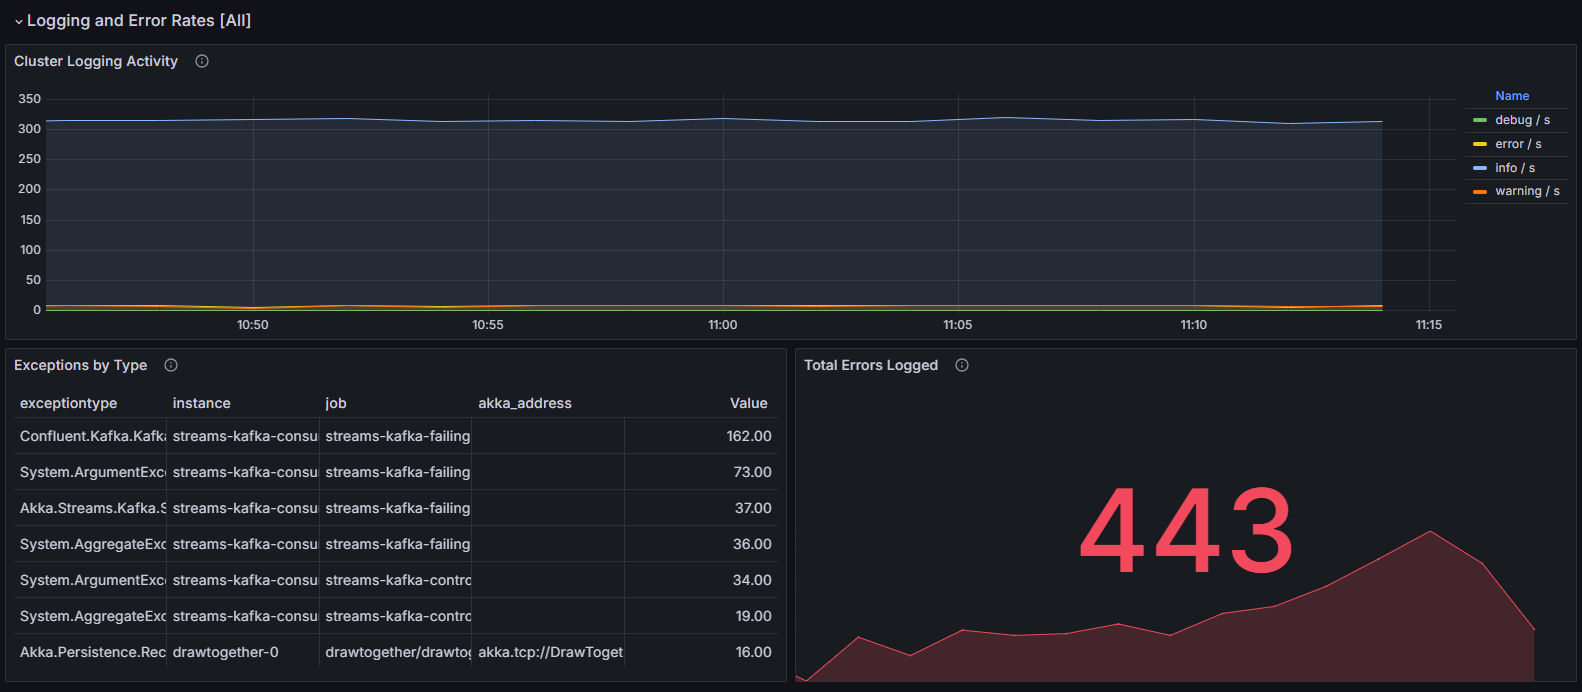
- Error Tracking: View logging activity, exception rates, and actor crash statistics
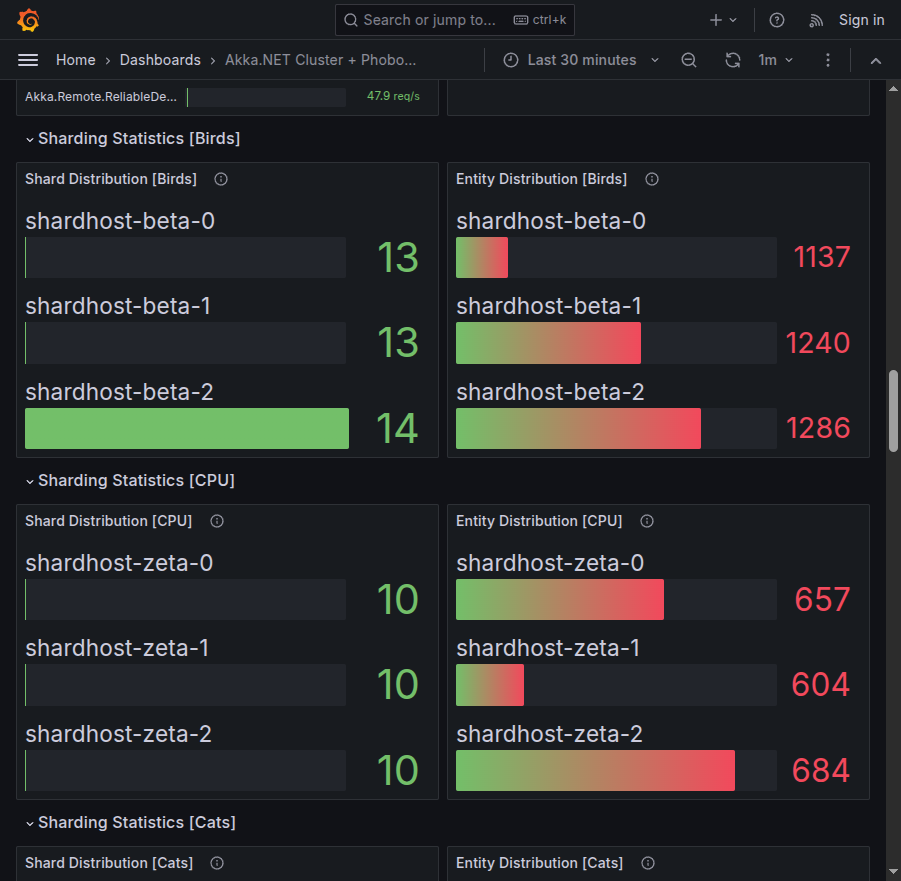
- Sharding Insights: Visualize shard and entity distribution across cluster nodes
- Real-time Alerting: Built-in thresholds for system pressure indicators
📋 Prerequisites
- Akka.NET application with Phobos 2.x instrumentation
- Prometheus data source configured in Grafana
- OpenTelemetry metrics collection enabled
🔧 Quick Setup
- Import dashboard JSON into your Grafana instance
- Configure Prometheus data source connection
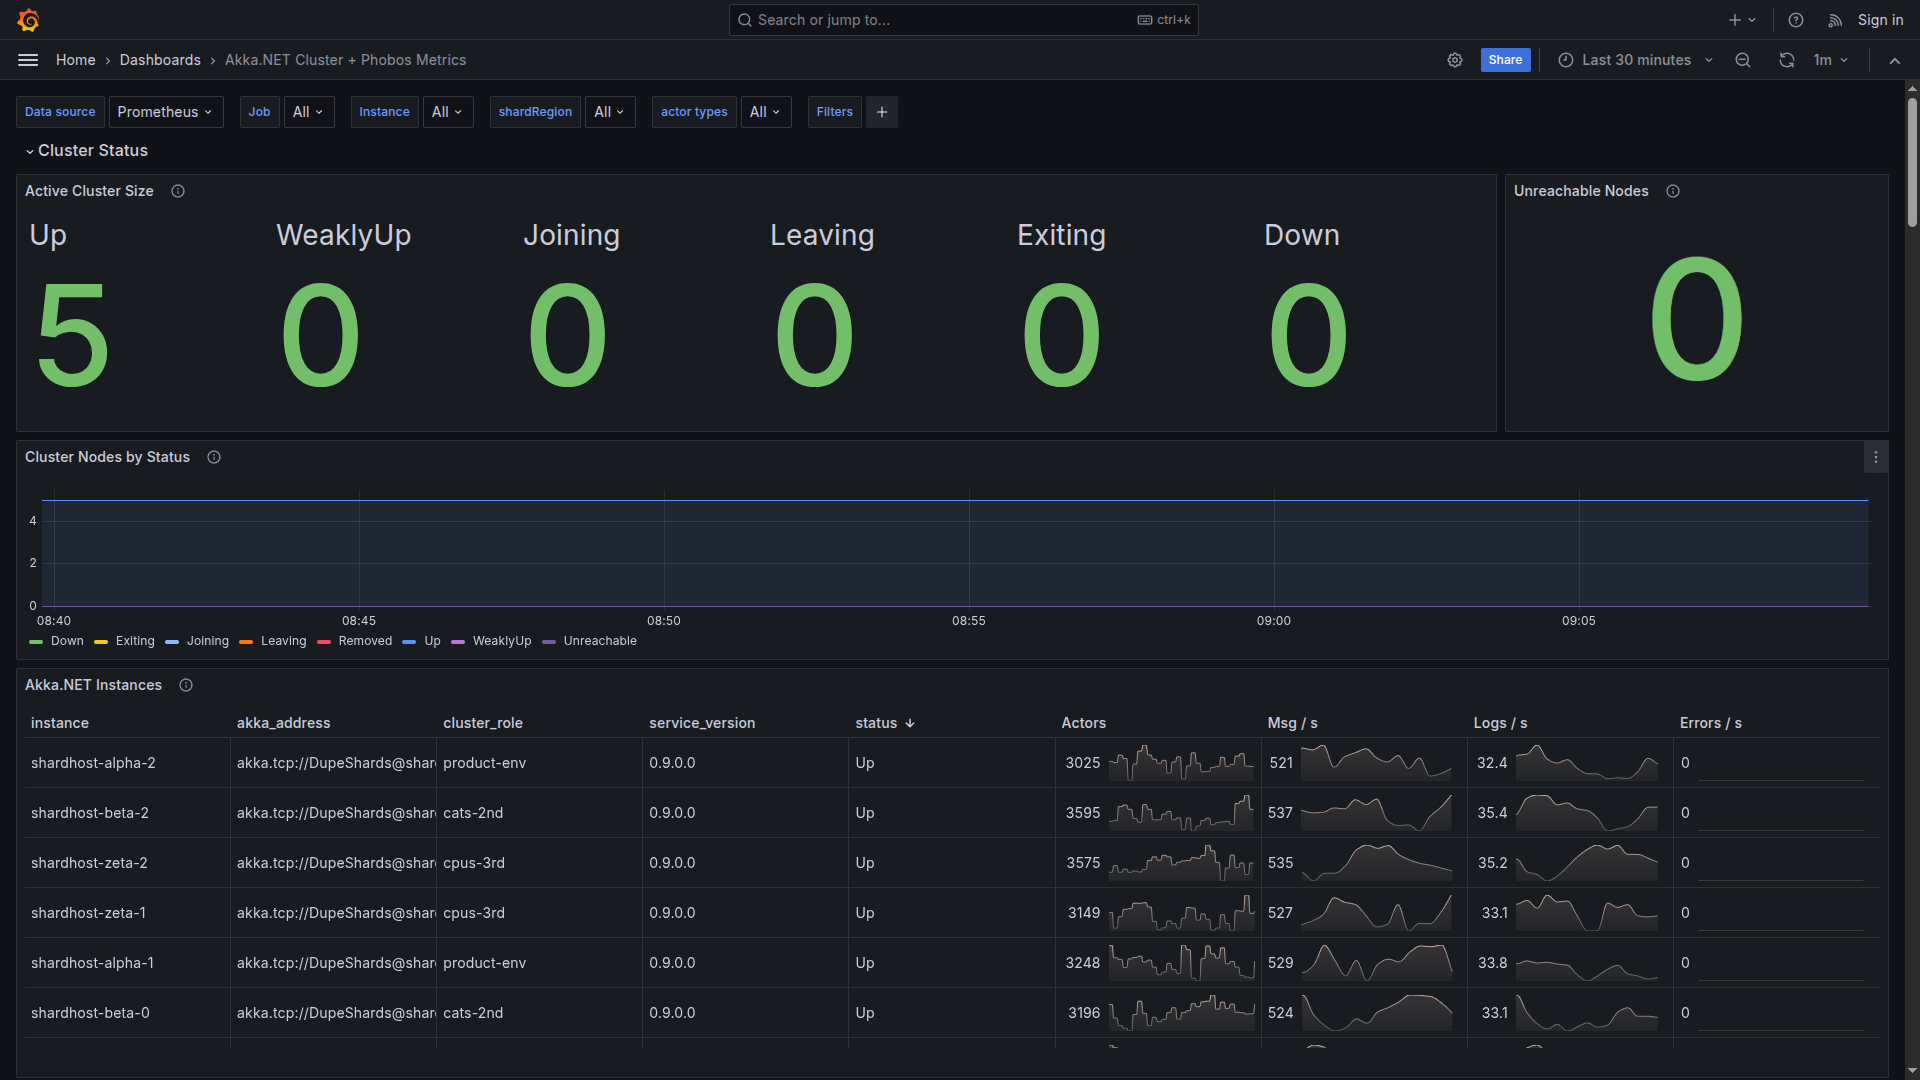
- Set dashboard variables for your environment:
- Job: Your OTEL workload name
- Instance: Specific application instances
- Actor Types: Filter by
/useror/systemactors - Shard Region: Available sharding regions
📊 Dashboard Sections
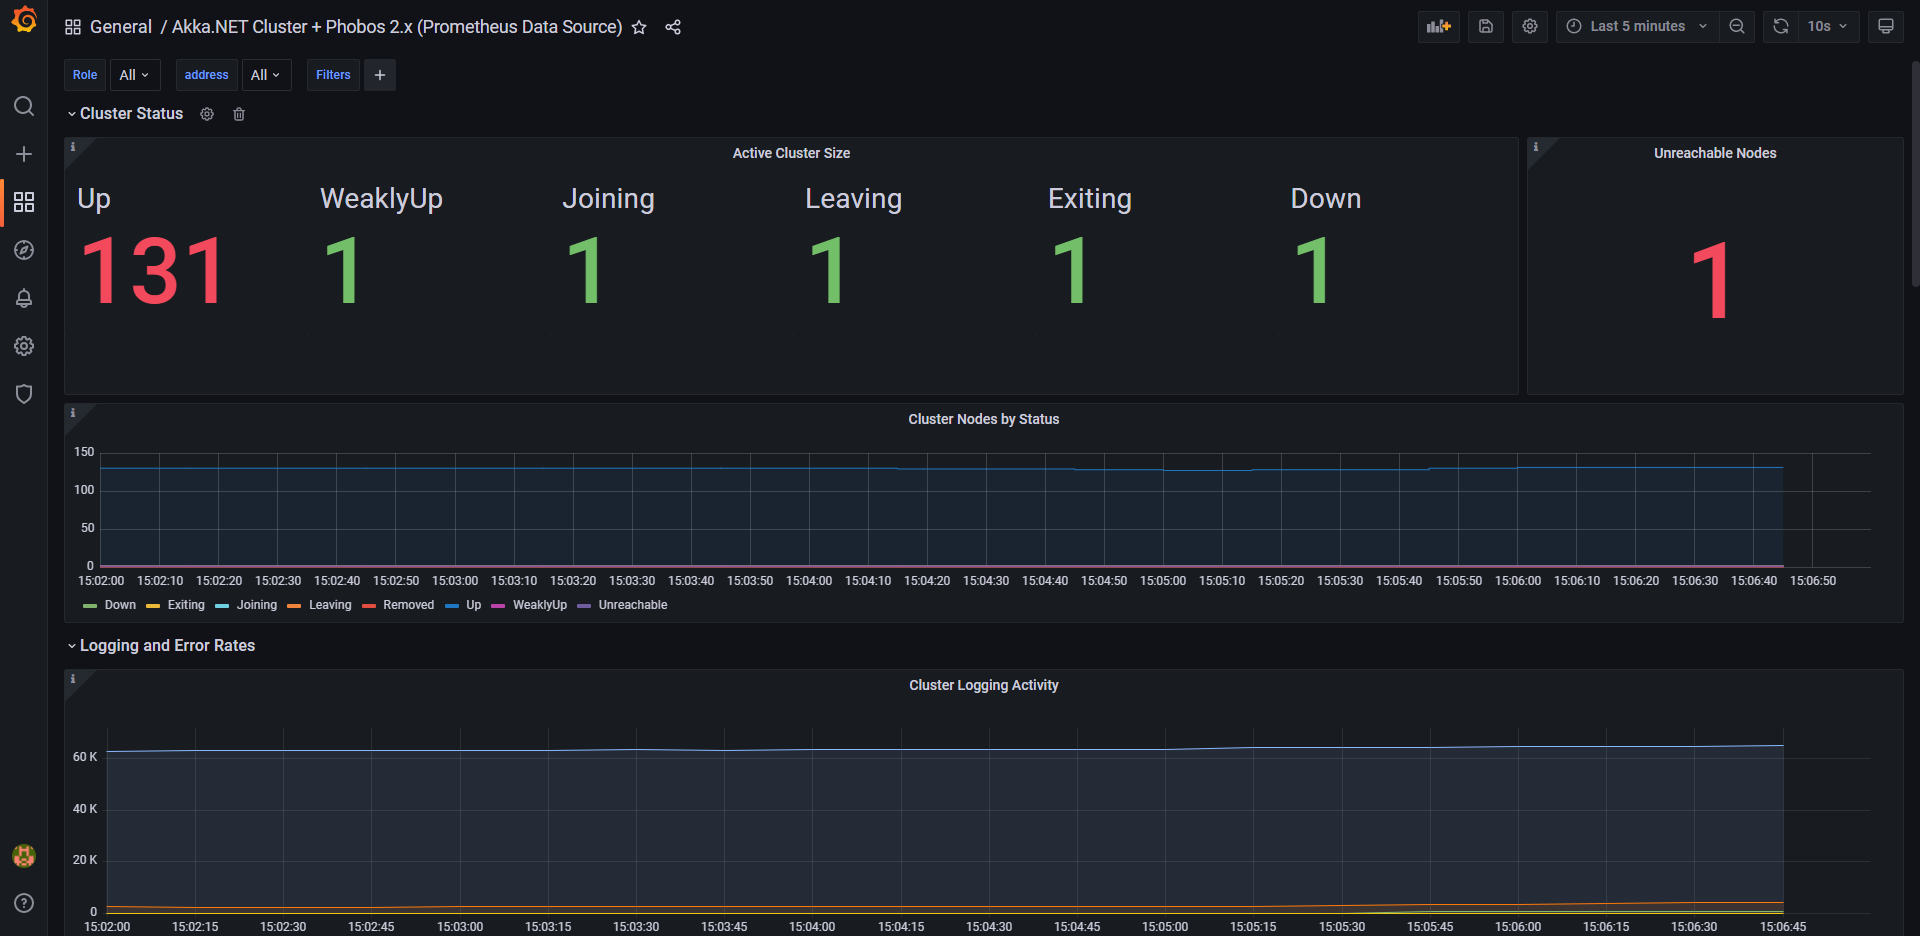
- Cluster Status: Node membership, reachability, and health overview
- Actor Metrics: Live actor counts, throughput, and mailbox monitoring
- Logging & Errors: Exception tracking and log analysis
- Sharding Statistics: Shard distribution and entity placement
🛠️ Customization
The dashboard supports filtering by job, instance, and actor categories. Use the built-in template variables to focus on specific parts of your cluster or application components.
📚 Documentation & Support
- Dashboard Repository: phobos-dashboards
- Phobos Documentation: phobos.petabridge.com
- Report Issues: Submit dashboard improvements and bug reports via GitHub Issues
Data source config
Collector type:
Collector plugins:
Collector config:
Revisions
Upload an updated version of an exported dashboard.json file from Grafana
| Revision | Description | Created | |
|---|---|---|---|
| Download |