Yet Another Prometheus NUT Exporter
Monitor your UPS over NUT service. Uses HON95/prometheus-nut-exporter and DRuggeri/nut_exporter
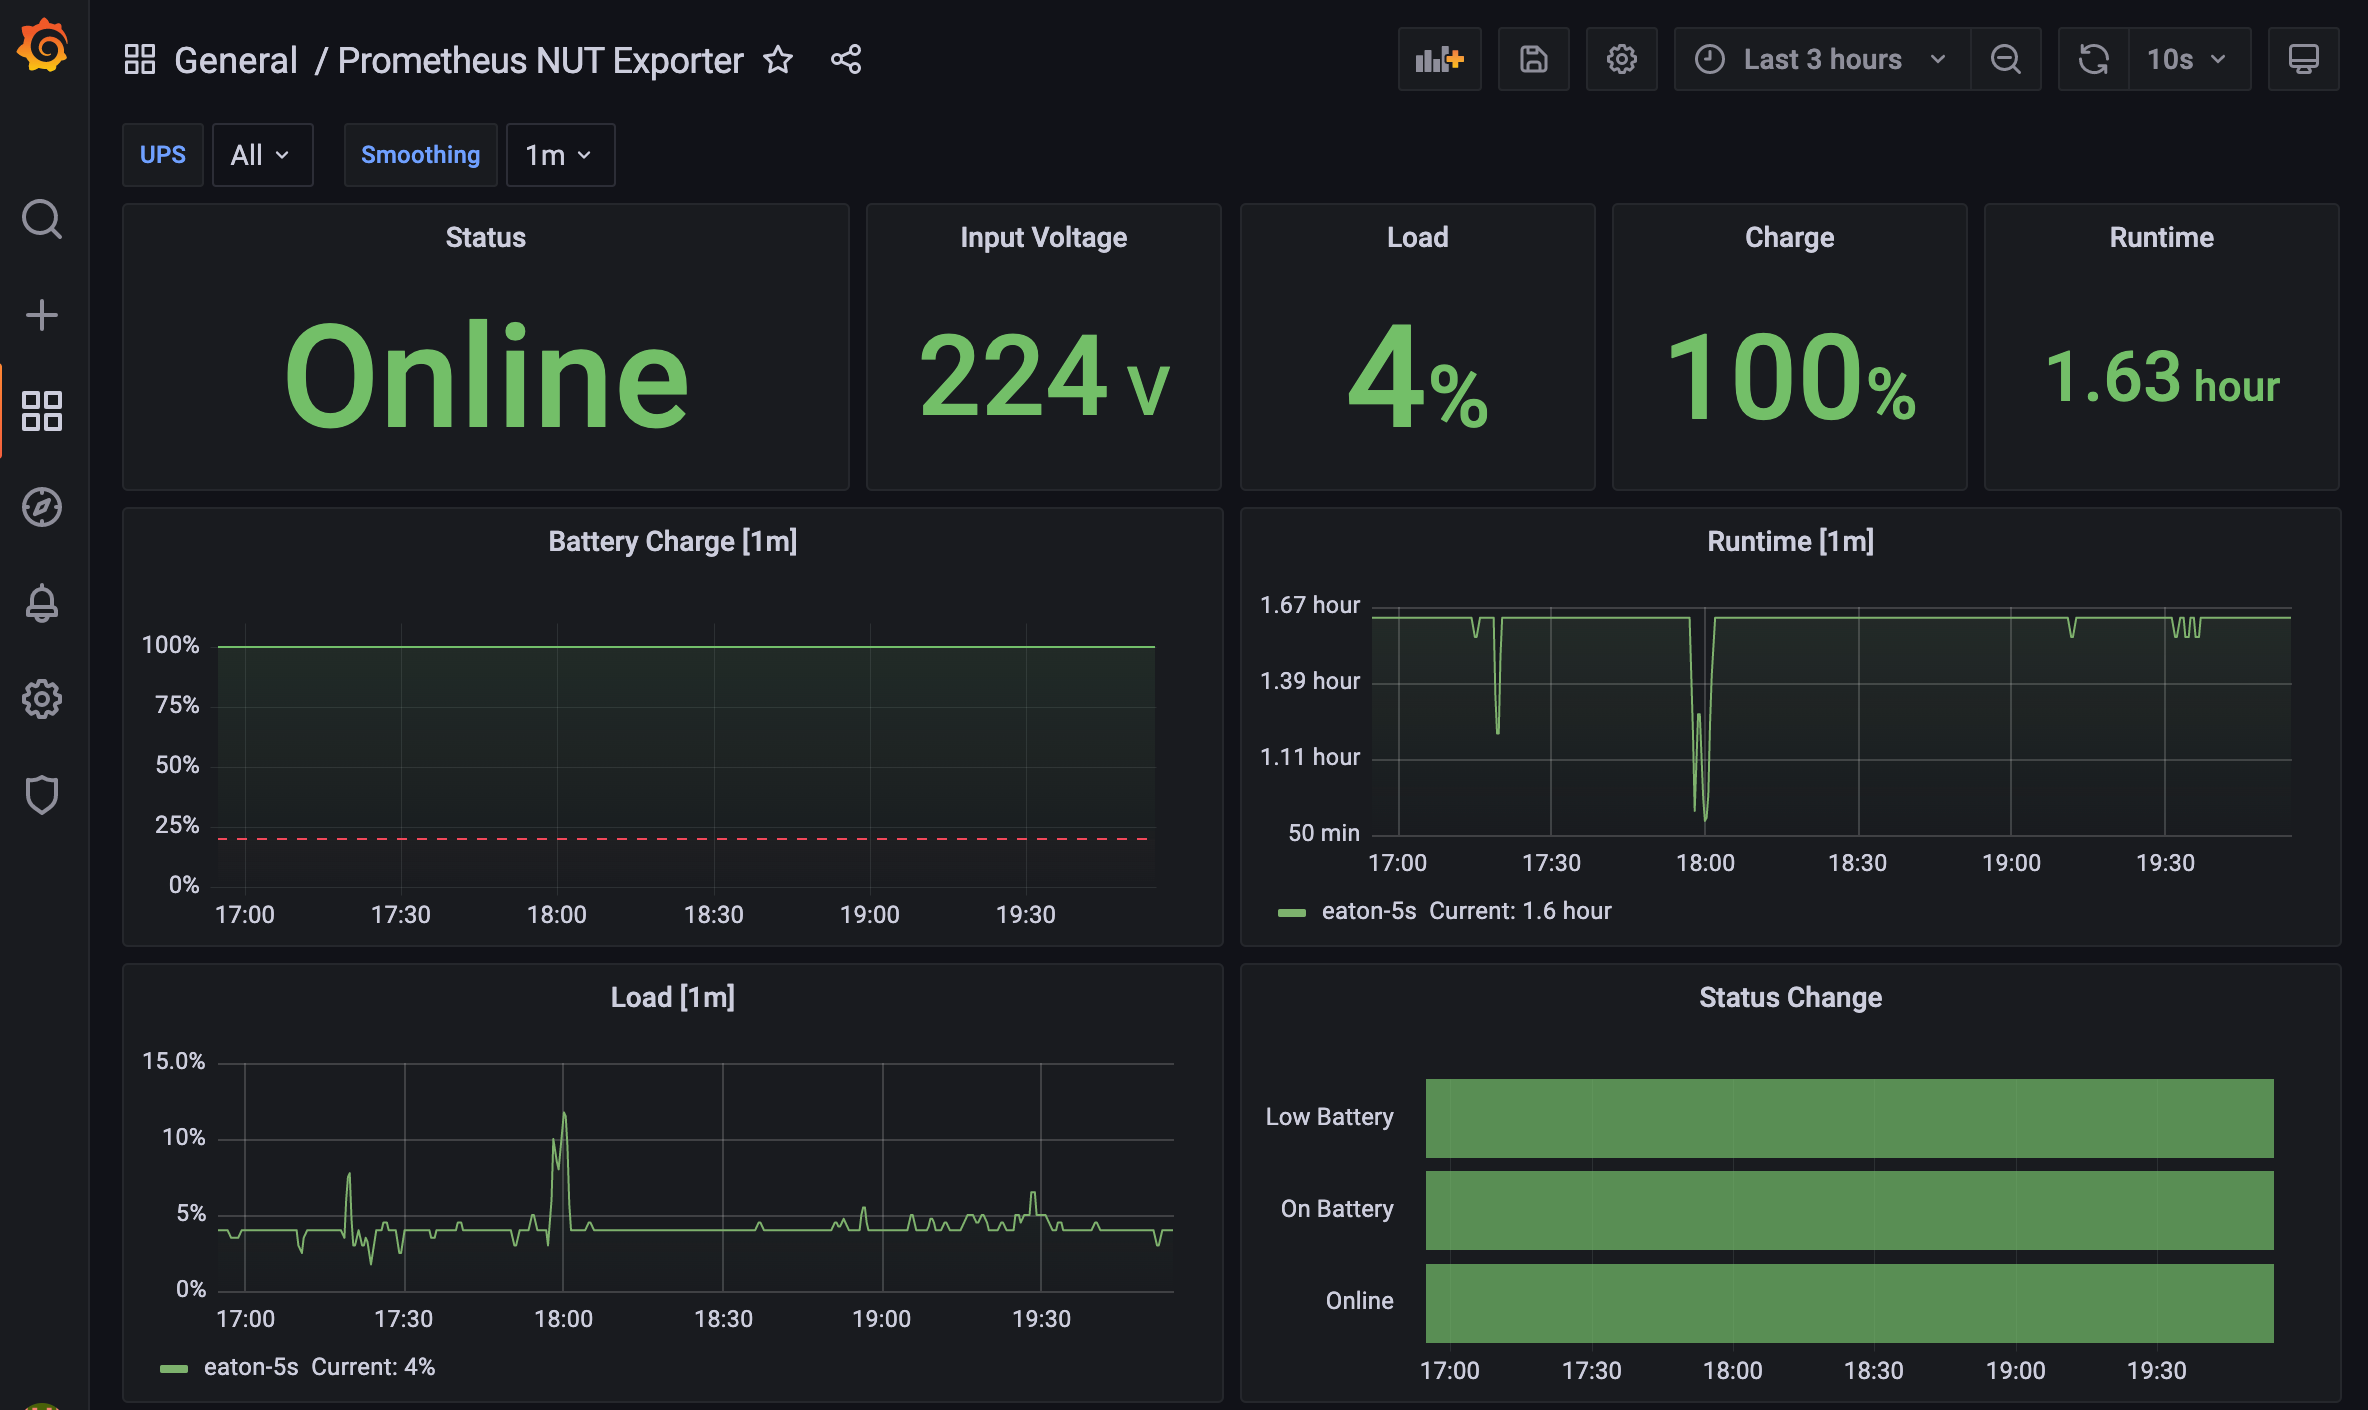
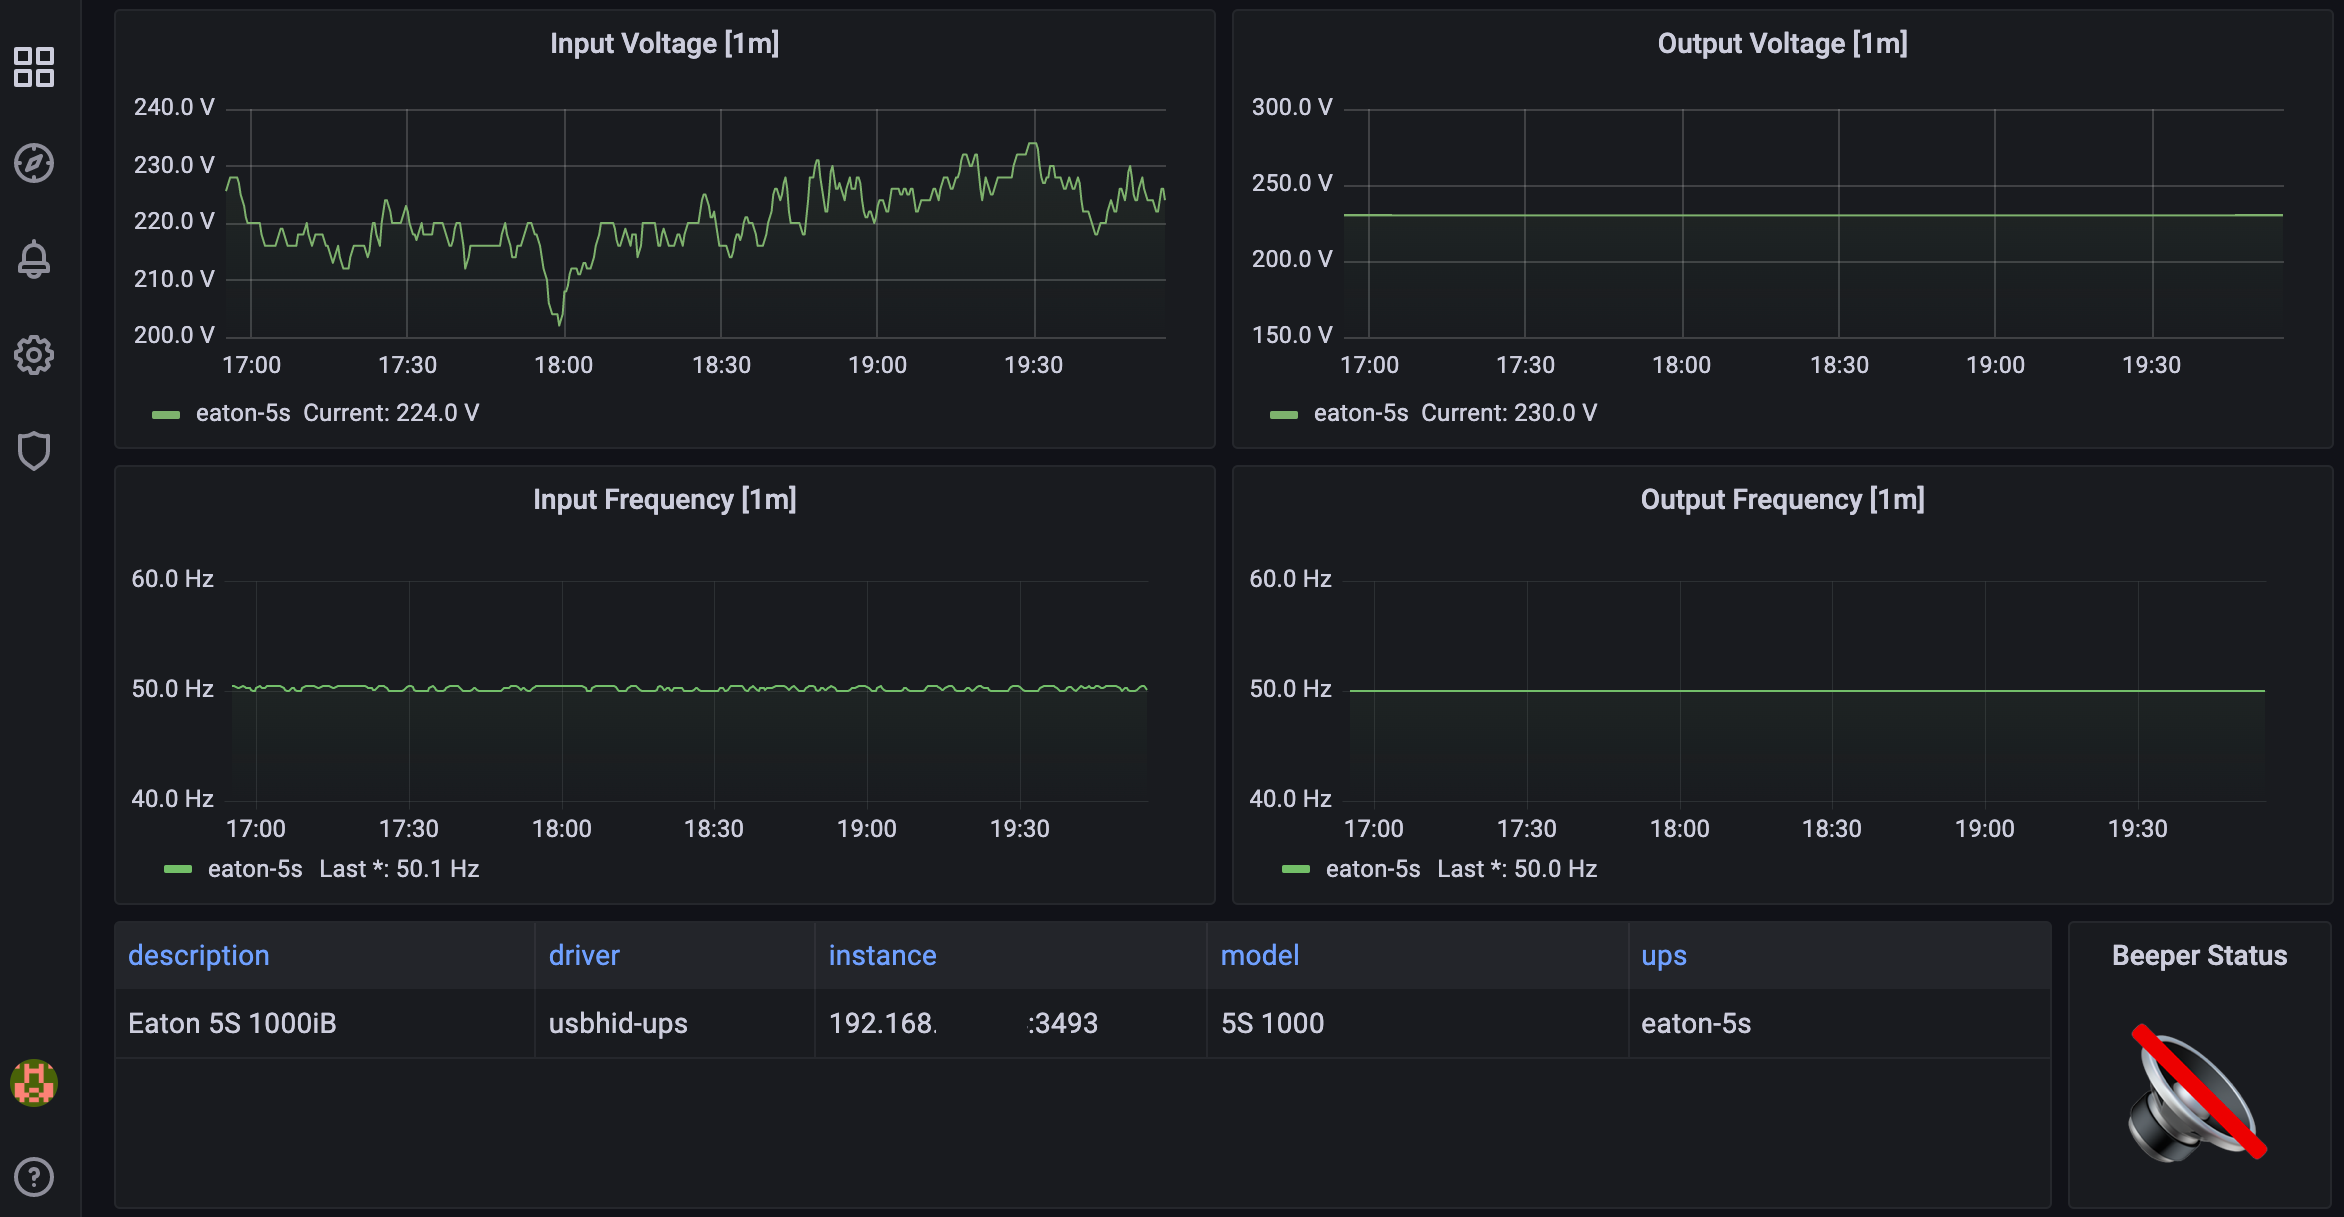
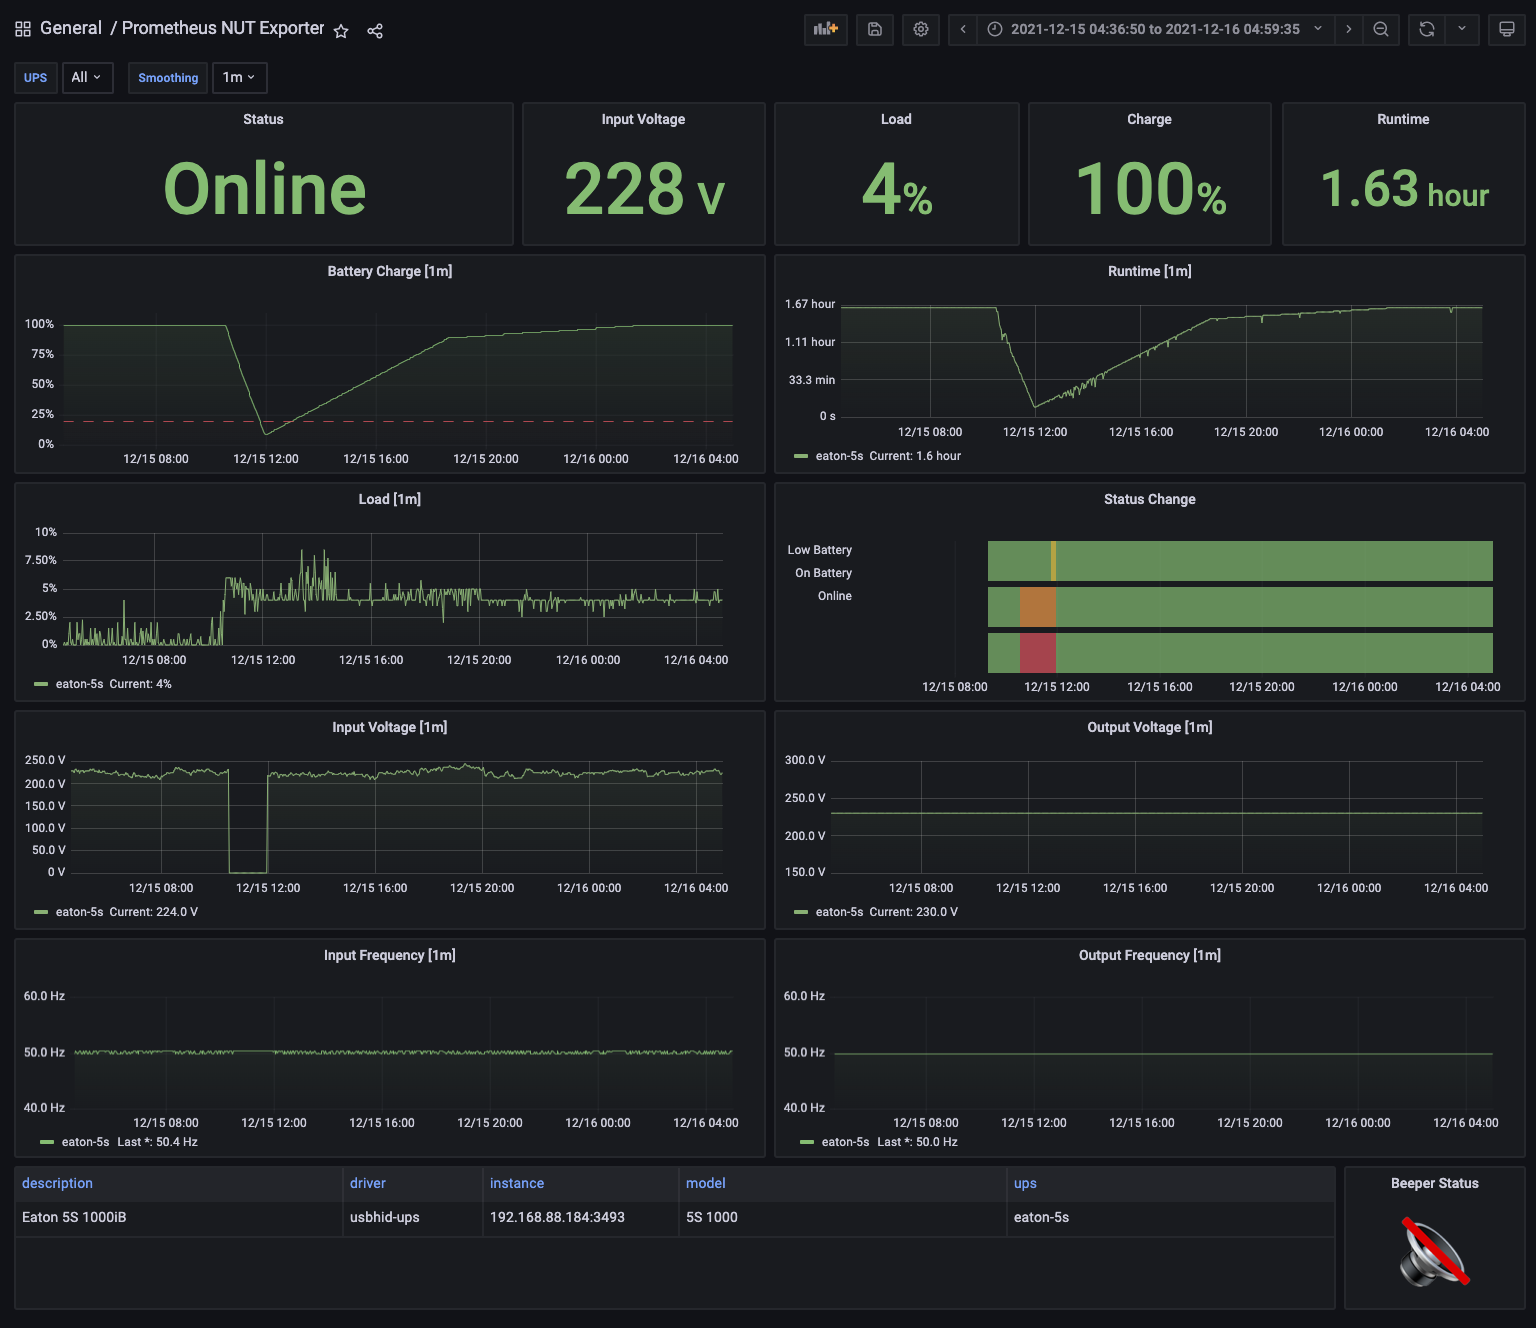
A dashboard to visualize statistics from a single UPS. I've optimized it for the Eaton 5S series, but it would theoretically work with anything compatible. Adjust statuses for your UPS in the mapping of "Status" and "Status Change" panels and enjoy the feeling of control. :)
It is based on DRuggeri/nut_exporter and HON95/prometheus-nut-exporter Prometheus NUT Exporters.
Huge kudos to HON95 for providing the dashboard which this one is built upon.
Data source config
Collector config:
Upload an updated version of an exported dashboard.json file from Grafana
| Revision | Description | Created | |
|---|---|---|---|
| Download |
Metrics Endpoint (Prometheus)
Easily monitor any Prometheus-compatible and publicly accessible metrics URL with Grafana Cloud's out-of-the-box monitoring solution.
Learn more


