
Tomcat JVM Overview
Display JMX statistics
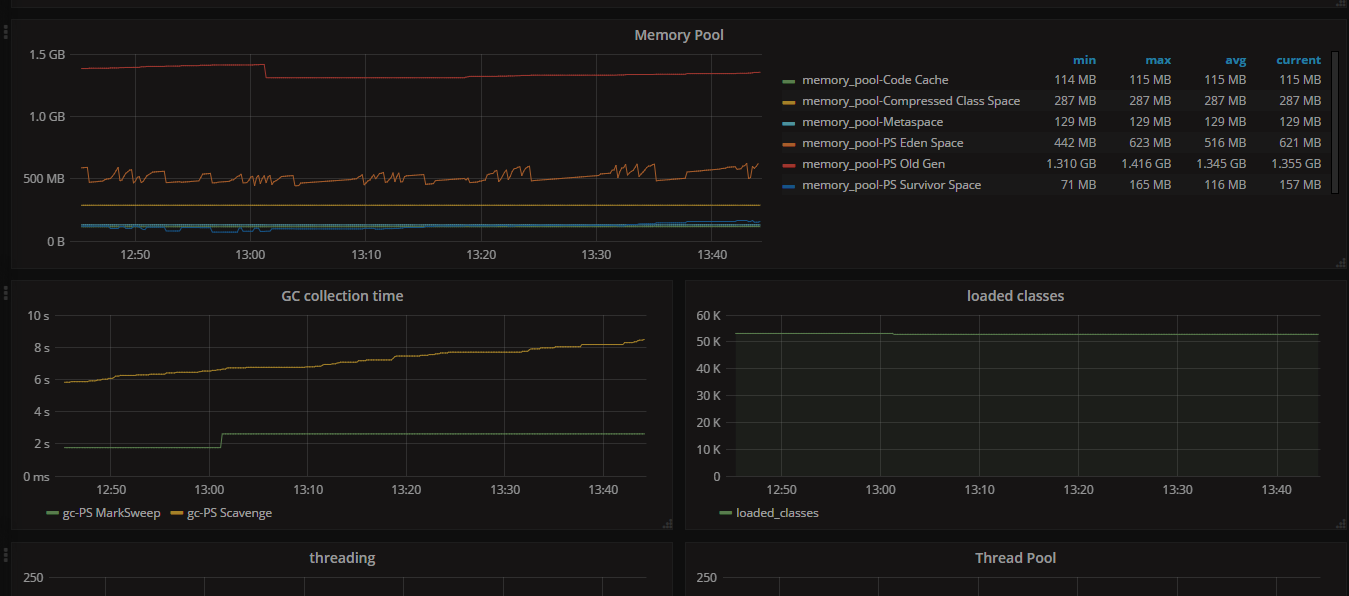
This dashboard display multiple JMX metrics from Tomcat. JMX needs to be enabled on the Tomcat instance.
This dashboard use https://github.com/egineering-llc/collectd-fast-jmx plugin. The configuration is a mix between multiple example confiugration files found on Internet:
LoadPlugin java
<Plugin "java">
JVMARG "-Djava.class.path=/usr/share/collectd/java/collectd-api.jar:/usr/share/collectd/java/collectd-fast-jmx.jar"
LoadPlugin "com.e_gineering.collectd.FastJMX"
<Plugin "FastJMX">
MaxThreads 256
CollectInternal true
<MBean "classes">
ObjectName "java.lang:type=ClassLoading"
<Value "LoadedClassCount">
Type "gauge"
InstancePrefix "loaded_classes"
PluginName "JVM"
</Value>
</MBean>
# Time spent by the JVM compiling or optimizing.
<MBean "compilation">
ObjectName "java.lang:type=Compilation"
<Value "TotalCompilationTime">
Type "total_time_in_ms"
InstancePrefix "compilation_time"
PluginName "JVM"
</Value>
</MBean>
# Garbage collector information
<MBean "garbage_collector">
ObjectName "java.lang:type=GarbageCollector,*"
InstancePrefix "gc-"
InstanceFrom "name"
<Value "CollectionTime">
Type "total_time_in_ms"
InstancePrefix "collection_time"
PluginName "JVM"
</Value>
</MBean>
<MBean "memory_pool">
ObjectName "java.lang:type=MemoryPool,"
InstancePrefix "memory_pool-"
InstanceFrom "name"
<Value>
Type "memory"
Table true
Attribute "Usage"
</Value>
</MBean>
<MBean "memory-heap">
ObjectName "java.lang:type=Memory"
InstancePrefix "memory-heap"
<Value>
Type "memory"
Table true
Attribute "HeapMemoryUsage"
</Value>
</MBean>
<MBean "memory-nonheap">
ObjectName "java.lang:type=Memory"
InstancePrefix "memory-nonheap"
<Value>
Type "memory"
Table true
Attribute "NonHeapMemoryUsage"
</Value>
</MBean>
<MBean "thread">
ObjectName "java.lang:type=Threading"
InstancePrefix "threading"
<Value>
Type "gauge"
Table false
Attribute "ThreadCount"
InstancePrefix "count"
</Value>
</MBean>
<MBean "thread-daemon">
ObjectName "java.lang:type=Threading"
InstancePrefix "threading"
<Value>
Type "gauge"
Table false
Attribute "DaemonThreadCount"
InstancePrefix "count-daemon"
</Value>
</MBean>
### MBeans by Catalina / Tomcat ###
# The global request processor (summary for each request processor)
<MBean "catalina/global_request_processor">
ObjectName "Catalina:type=GlobalRequestProcessor,"
InstancePrefix "catalina_request_processor-"
InstanceFrom "name"
<Value>
Type "io_octets"
InstancePrefix "global"
#InstanceFrom ""
Table false
Attribute "bytesReceived"
Attribute "bytesSent"
</Value>
<Value>
Type "total_requests"
InstancePrefix "global"
#InstanceFrom ""
Table false
Attribute "requestCount"
</Value>
<Value>
Type "total_time_in_ms"
InstancePrefix "global-processing"
#InstanceFrom ""
Table false
Attribute "processingTime"
</Value>
</MBean>
<MBean "catalina/threadpool">
ObjectName "Catalina:type=ThreadPool,*"
InstancePrefix "catalina_threadpool-"
InstanceFrom "name"
<Value>
Type "gauge"
Table false
Attribute "maxThreads"
InstancePrefix "threadpool-maxThreads"
</Value>
<Value>
Type "gauge"
Table false
Attribute "connectionCount"
InstancePrefix "threadpool-connectionCount"
</Value>
</MBean>
<MBean "tomcat_manager">
ObjectName "Catalina:type=Manager,context=*,host=*"
InstanceFrom "context"
<Value>
Type "gauge"
InstancePrefix "manager-active_sessions"
Table false
Attribute "activeSessions"
</Value>
</MBean>
<MBean "jvm_runtime">
ObjectName "java.lang:type=Runtime"
<Value>
Type "counter"
InstancePrefix "runtime-uptime"
Table false
Attribute "Uptime"
</Value>
</MBean>
<MBean "jvm_system">
ObjectName "java.lang:type=OperatingSystem"
<Value>
Type "gauge"
InstancePrefix "os-open_fd_count"
Table false
Attribute "OpenFileDescriptorCount"
</Value>
<Value>
Type "counter"
InstancePrefix "os-process_cpu_time"
Table false
Attribute "ProcessCpuTime"
</Value>
</MBean>
<Connection>
ServiceURL "service:jmx:rmi:///jndi/rmi://myserver:9090/jmxrmi"
Host "myserver"
User "myuser"
Password "mypassword"
IncludePortInHostname true
Collect "classes"
Collect "thread"
Collect "thread-daemon"
Collect "compilation"
Collect "garbage_collector"
Collect "memory_pool"
Collect "memory-heap"
Collect "memory-nonheap"
Collect "catalina/global_request_processor"
Collect "catalina/threadpool"
Collect "jvm_system"
Collect "jvm_runtime"
Collect "tomcat_manager"
</Connection>
</Plugin>
</Plugin>
Data source config
Collector config:
Upload an updated version of an exported dashboard.json file from Grafana
| Revision | Description | Created | |
|---|---|---|---|
| Download |
Apache Tomcat
Easily monitor Apache Tomcat, an open source web server and servlet container that can run Java-based web applications, with Grafana Cloud's out-of-the-box monitoring solution.
Learn more