
Github Traffic
Dashboard for github-traffic.
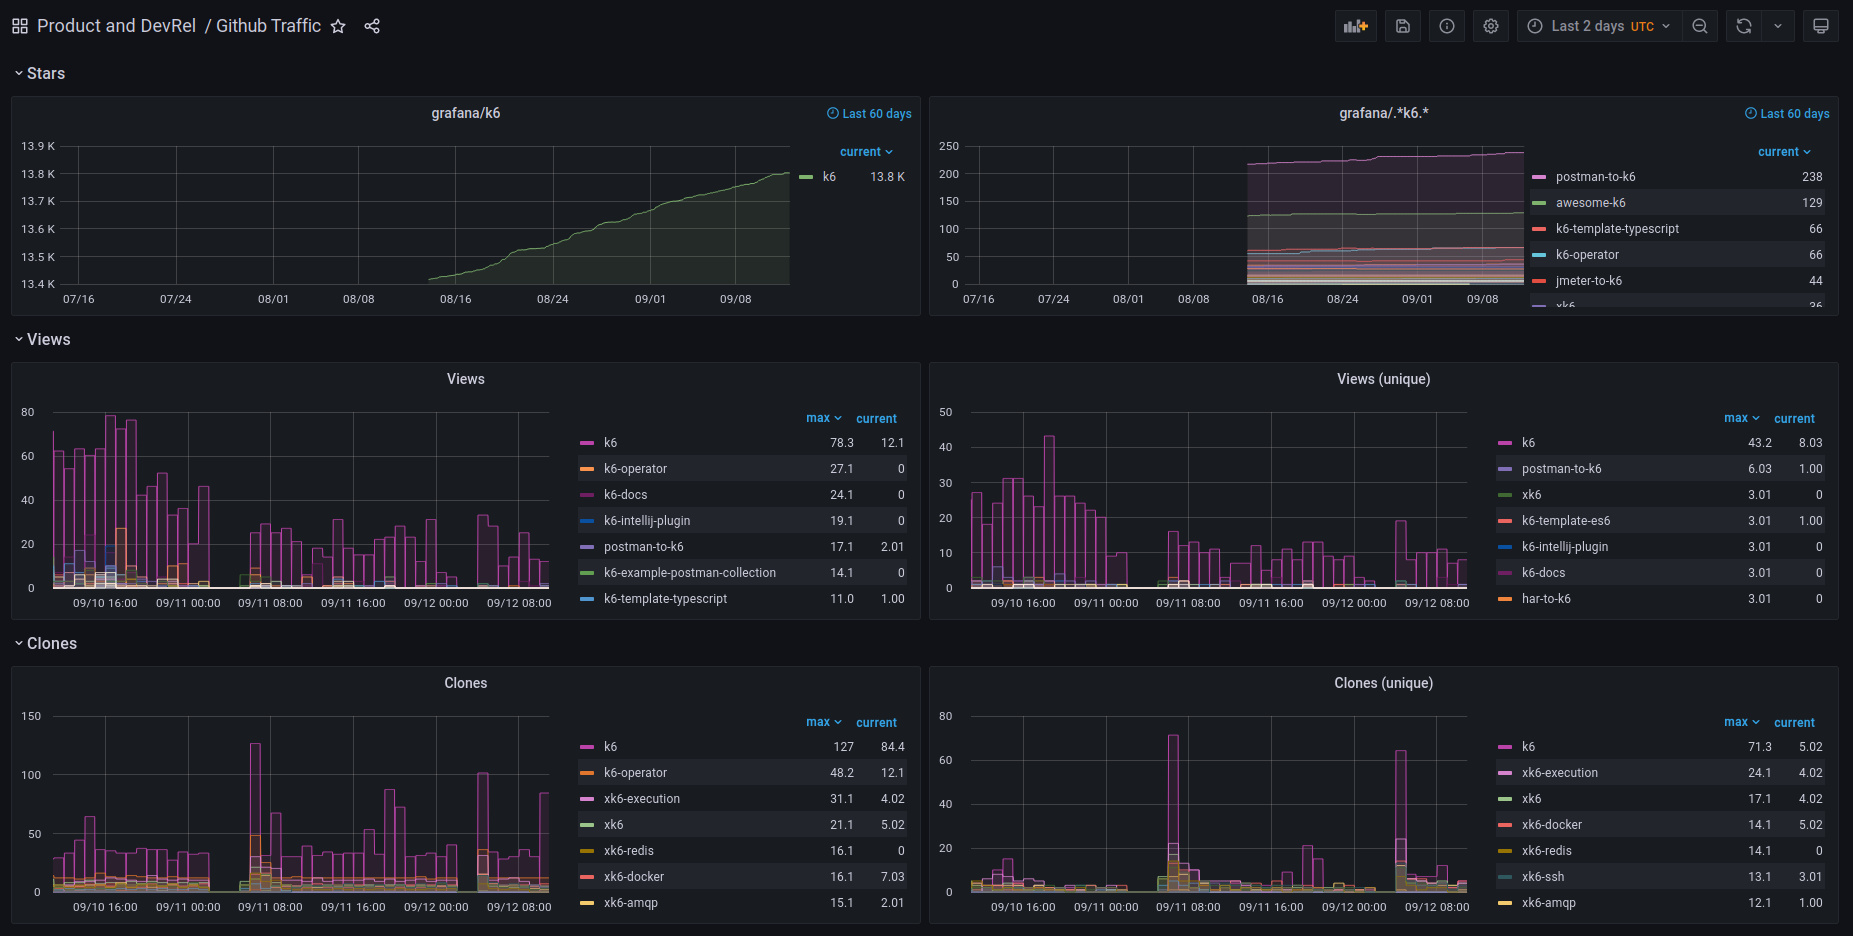
This dashboard is a companion for github-traffic.
github-traffic is a small tool that collects your repository's traffic data and exposes it as Prometheus metrics.
Data source config
Collector type:
Collector plugins:
Collector config:
Revisions
Upload an updated version of an exported dashboard.json file from Grafana
| Revision | Description | Created | |
|---|---|---|---|
| Download |
GitHub
Easily monitor GitHub, a service for software development and version control using Git, with Grafana Cloud's out-of-the-box monitoring solution.
Learn more