
Prometheus Blackbox Exporter
Prometheus Blackbox Exporter Overview
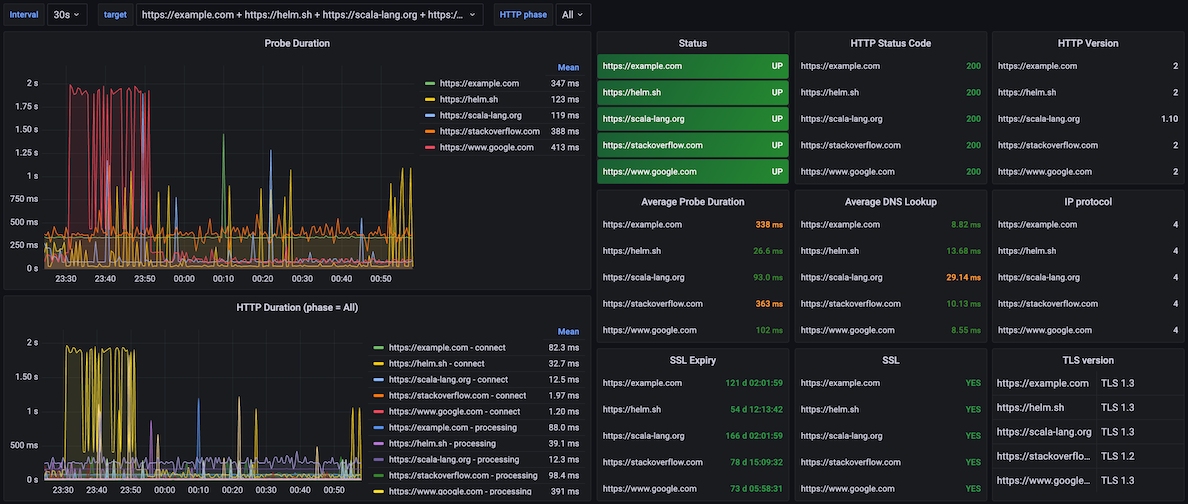
A Prometheus that scrapes a Blackbox Exporter with target as the probe target's name (re)labeled.
Features:
- HTTP status codes/versions/phases
- Probe duration colorful thresholds
- DNS duration colorful thresholds
- SSL/TLS certificate expiration
- SSL version
- IP version
Check out my post about setting up kube-prometheus-stack + blackbox-exporter on Medium
See:
Credits to original authors:
Data source config
Collector type:
Collector plugins:
Collector config:
Revisions
Upload an updated version of an exported dashboard.json file from Grafana
| Revision | Description | Created | |
|---|---|---|---|
| Download |
Metrics Endpoint (Prometheus)
Easily monitor any Prometheus-compatible and publicly accessible metrics URL with Grafana Cloud's out-of-the-box monitoring solution.
Learn more