
Pod Metrics for Azure Kubernetes Services | Azure Monitor | Azure Container Insights
Azure Monitor Container Insights - Pod and Container Metrics Azure Monitor for Containers sources collection of metrics as part of monitoring an AKS cluster. Out of the box, we can get dashboards for Node Level and Namespace level metrics in Grafana through App Insights and Log Analytics. This dashboard helps us to visualize pod level and container metric.

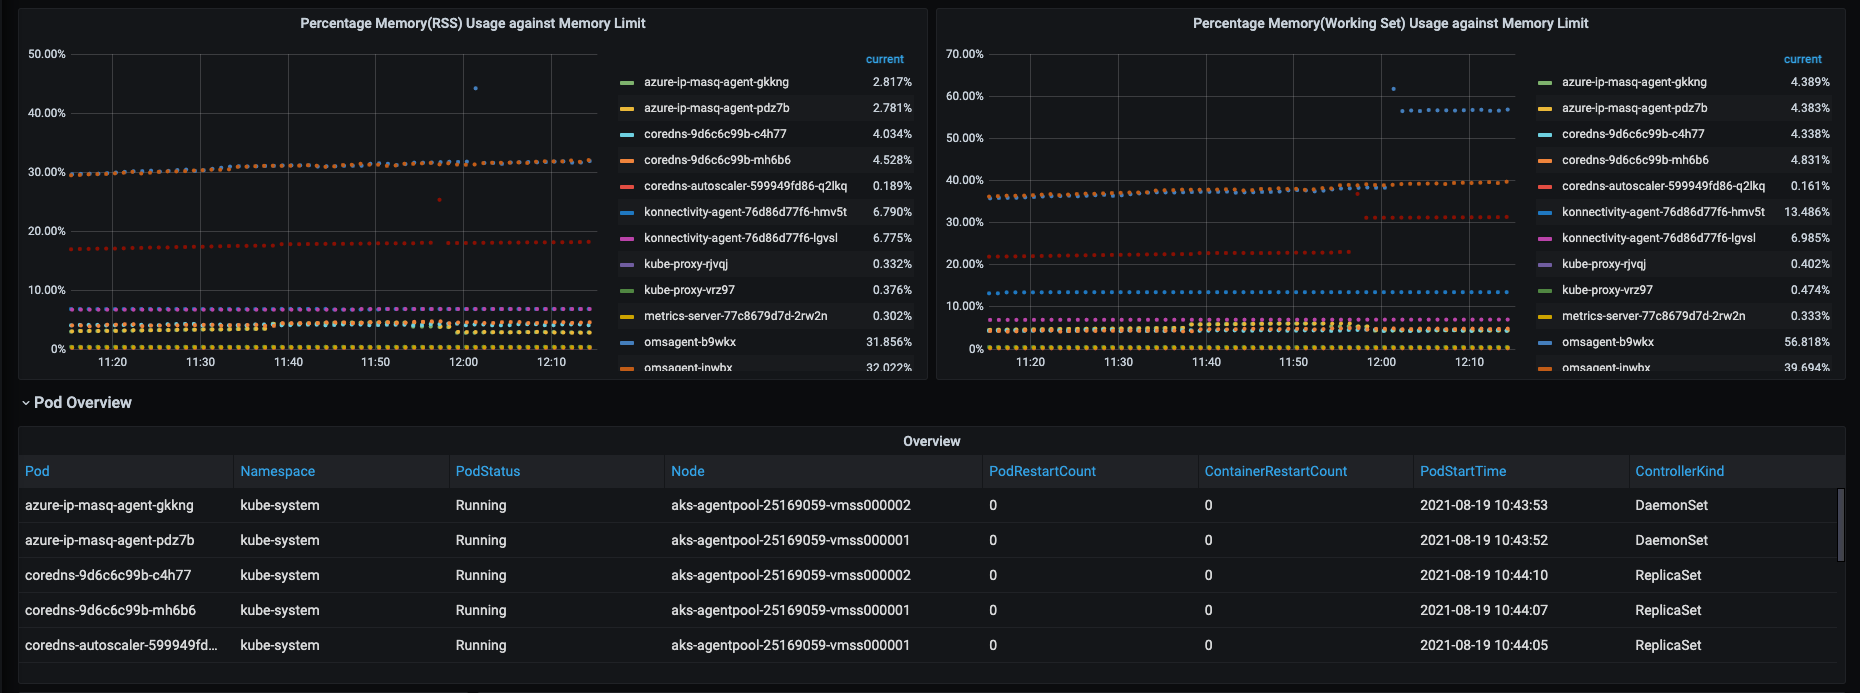
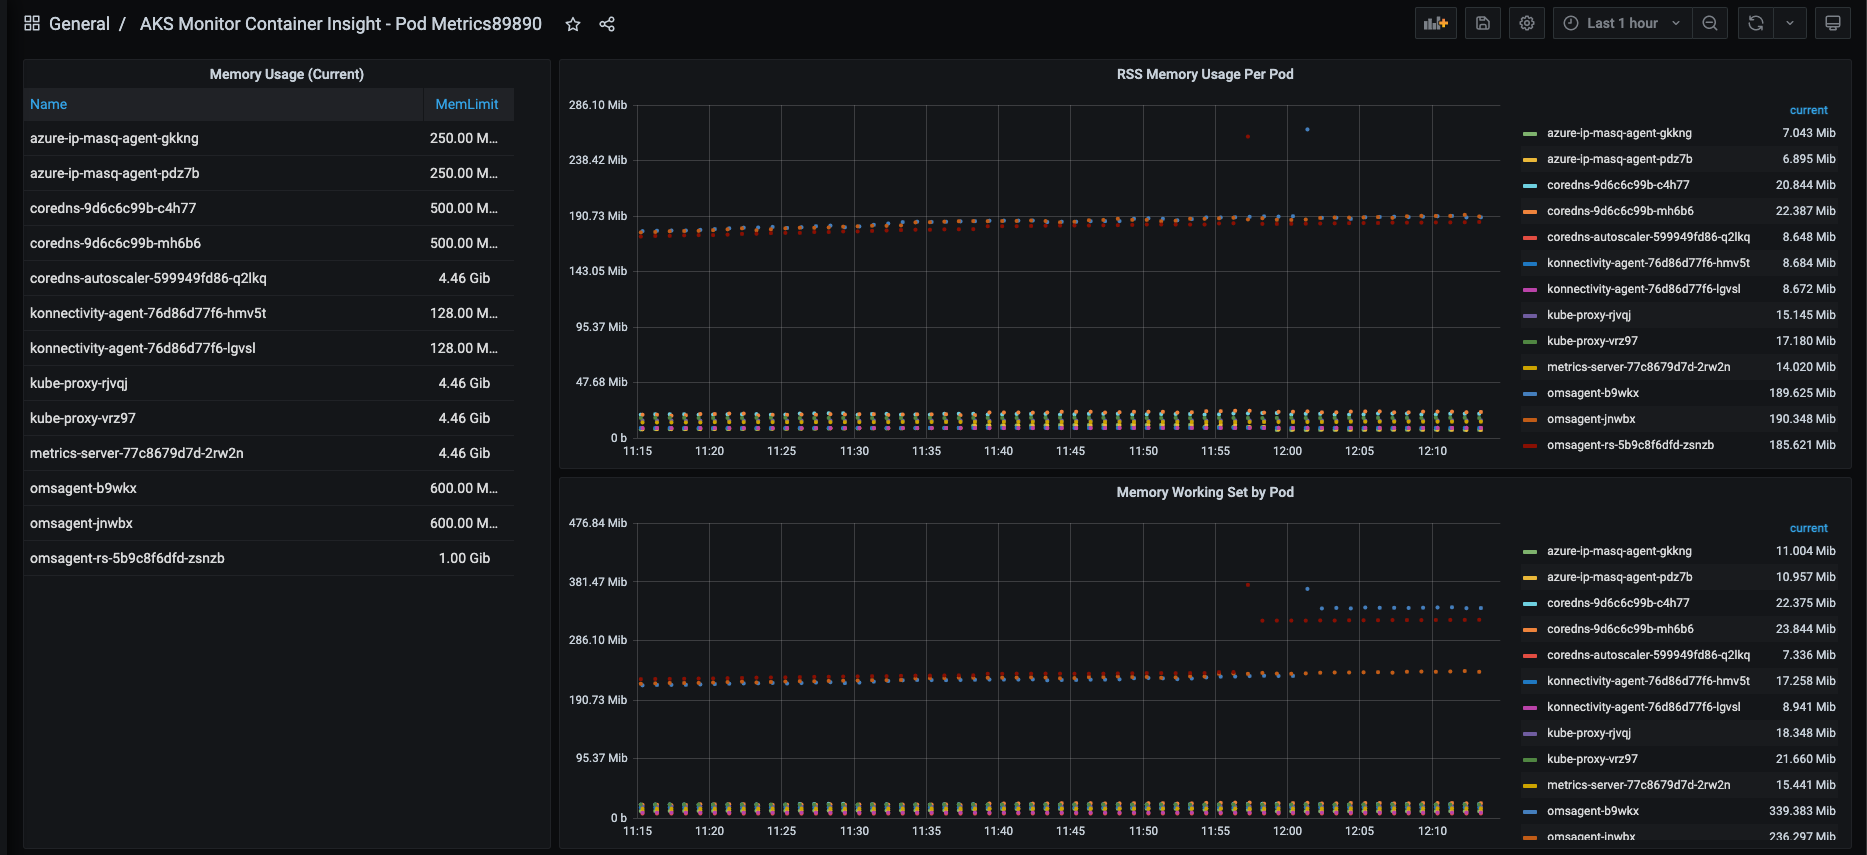
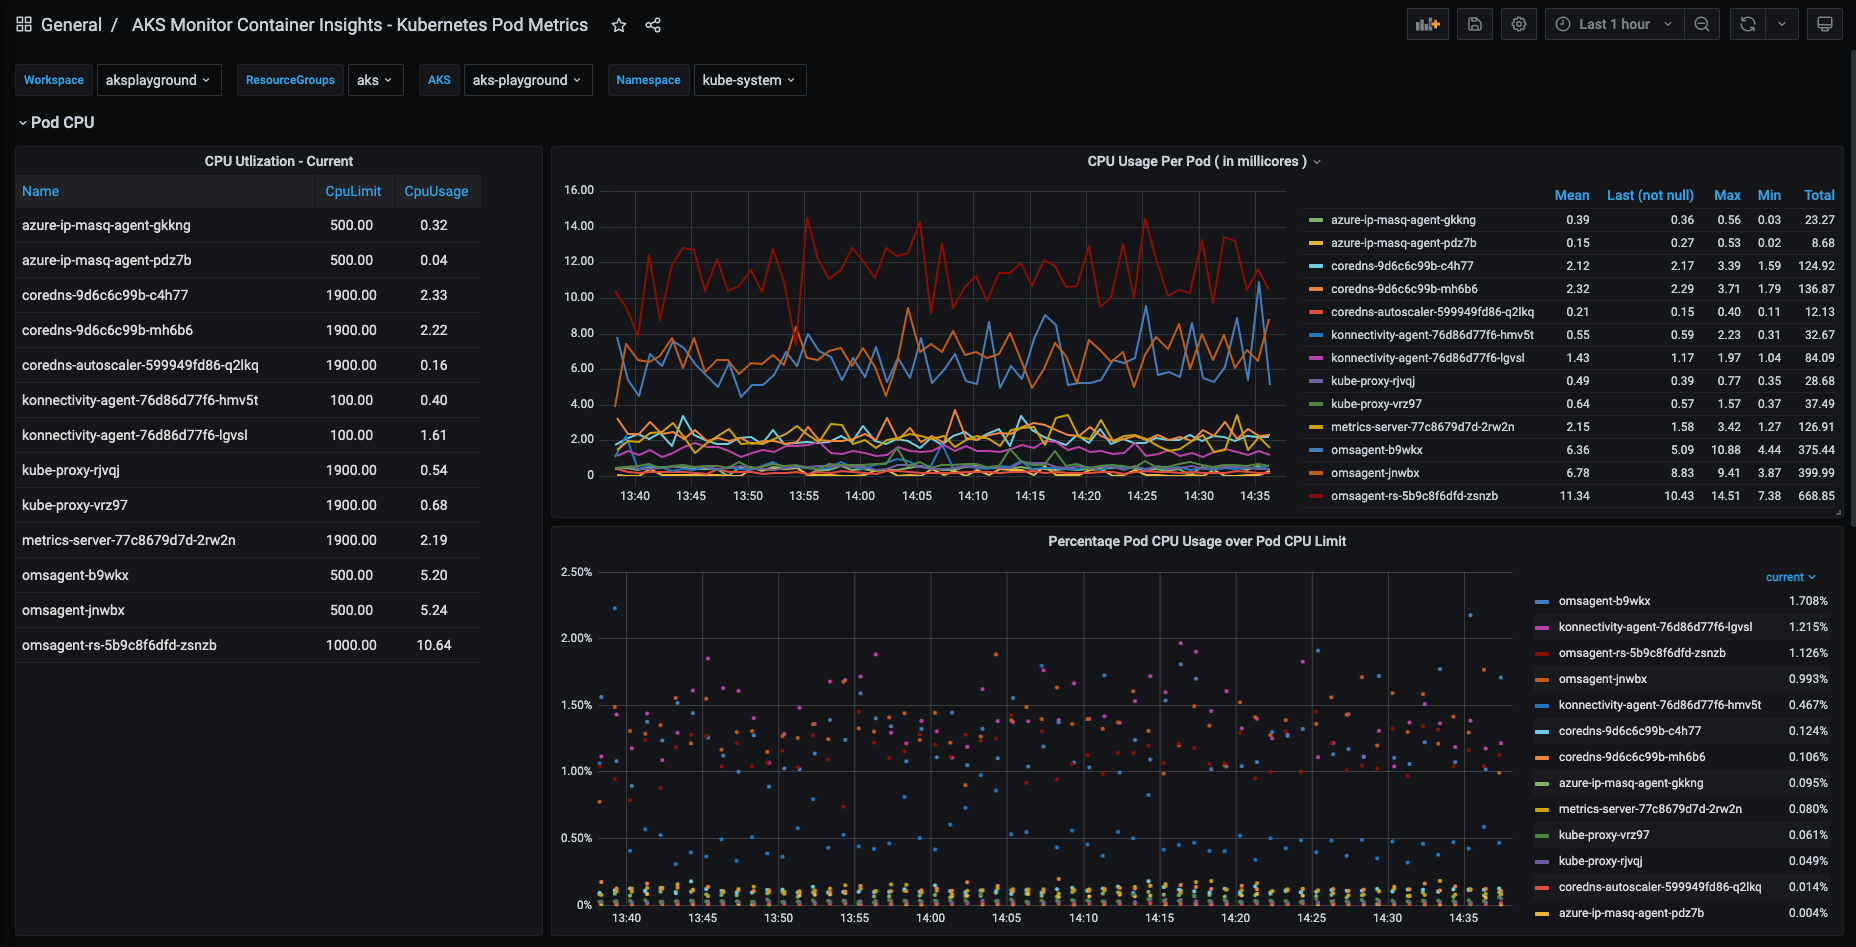
Azure Monitor for Containers sources collection of metrics as part of monitoring an AKS cluster. Out of the box, we can get dashboards for Node Level and Namespace level metrics in Grafana. This dashboard helps us visualize Pod Metrics like CPU and memory in Grafana using Kusto Queries.
Data source config
Collector config:
Upload an updated version of an exported dashboard.json file from Grafana
| Revision | Description | Created | |
|---|---|---|---|
| Download |
Kubernetes
Monitor your Kubernetes deployment with prebuilt visualizations that allow you to drill down from a high-level cluster overview to pod-specific details in minutes.
Learn more