
Grafana Dashboard for Veeam Backup for Microsoft Office 365 - Backup Admin Audit Log
Grafana Dashboard for Veeam Backup for Microsoft Office 365 - Backup Admin Audit Log
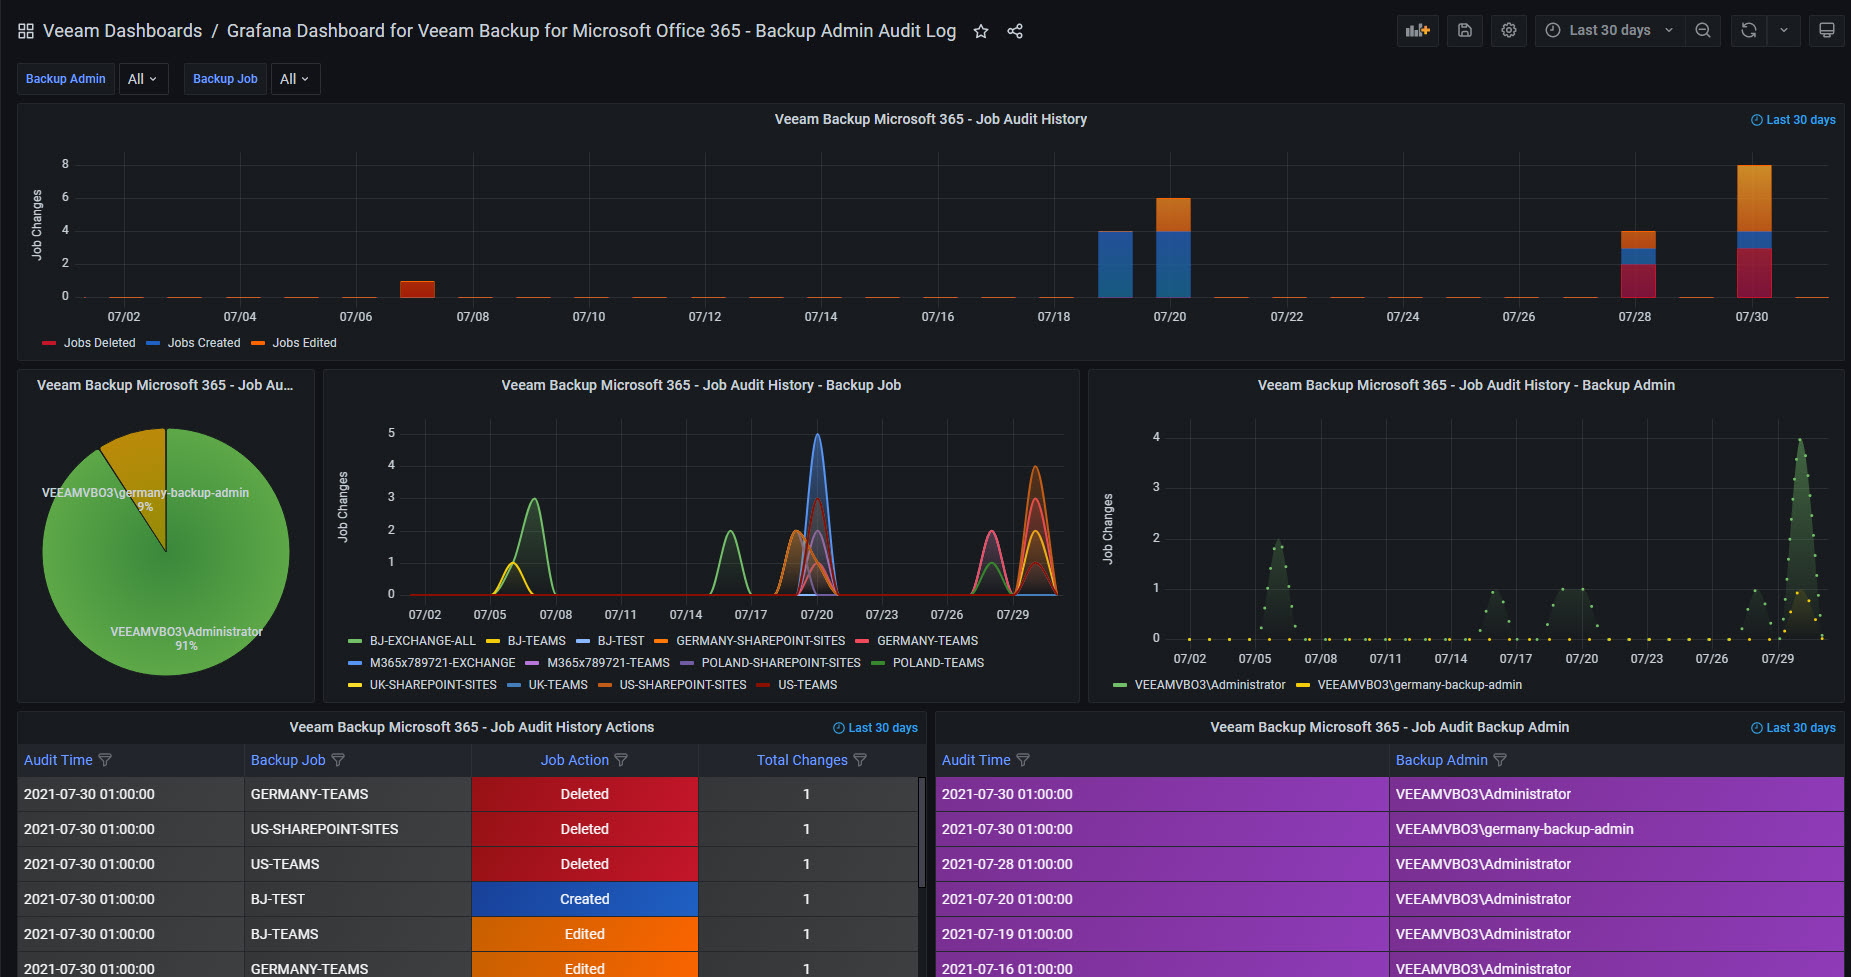
This Dashboard works natively by using telegraf and the tail plugin, using the log that can be found here - C:\ProgramData\Veeam\Backup365\Logs\Veeam.Archiver.Shell*.log :
The grok patterns can be found on the section above, add them into your telegraf, restart the telegraf service.
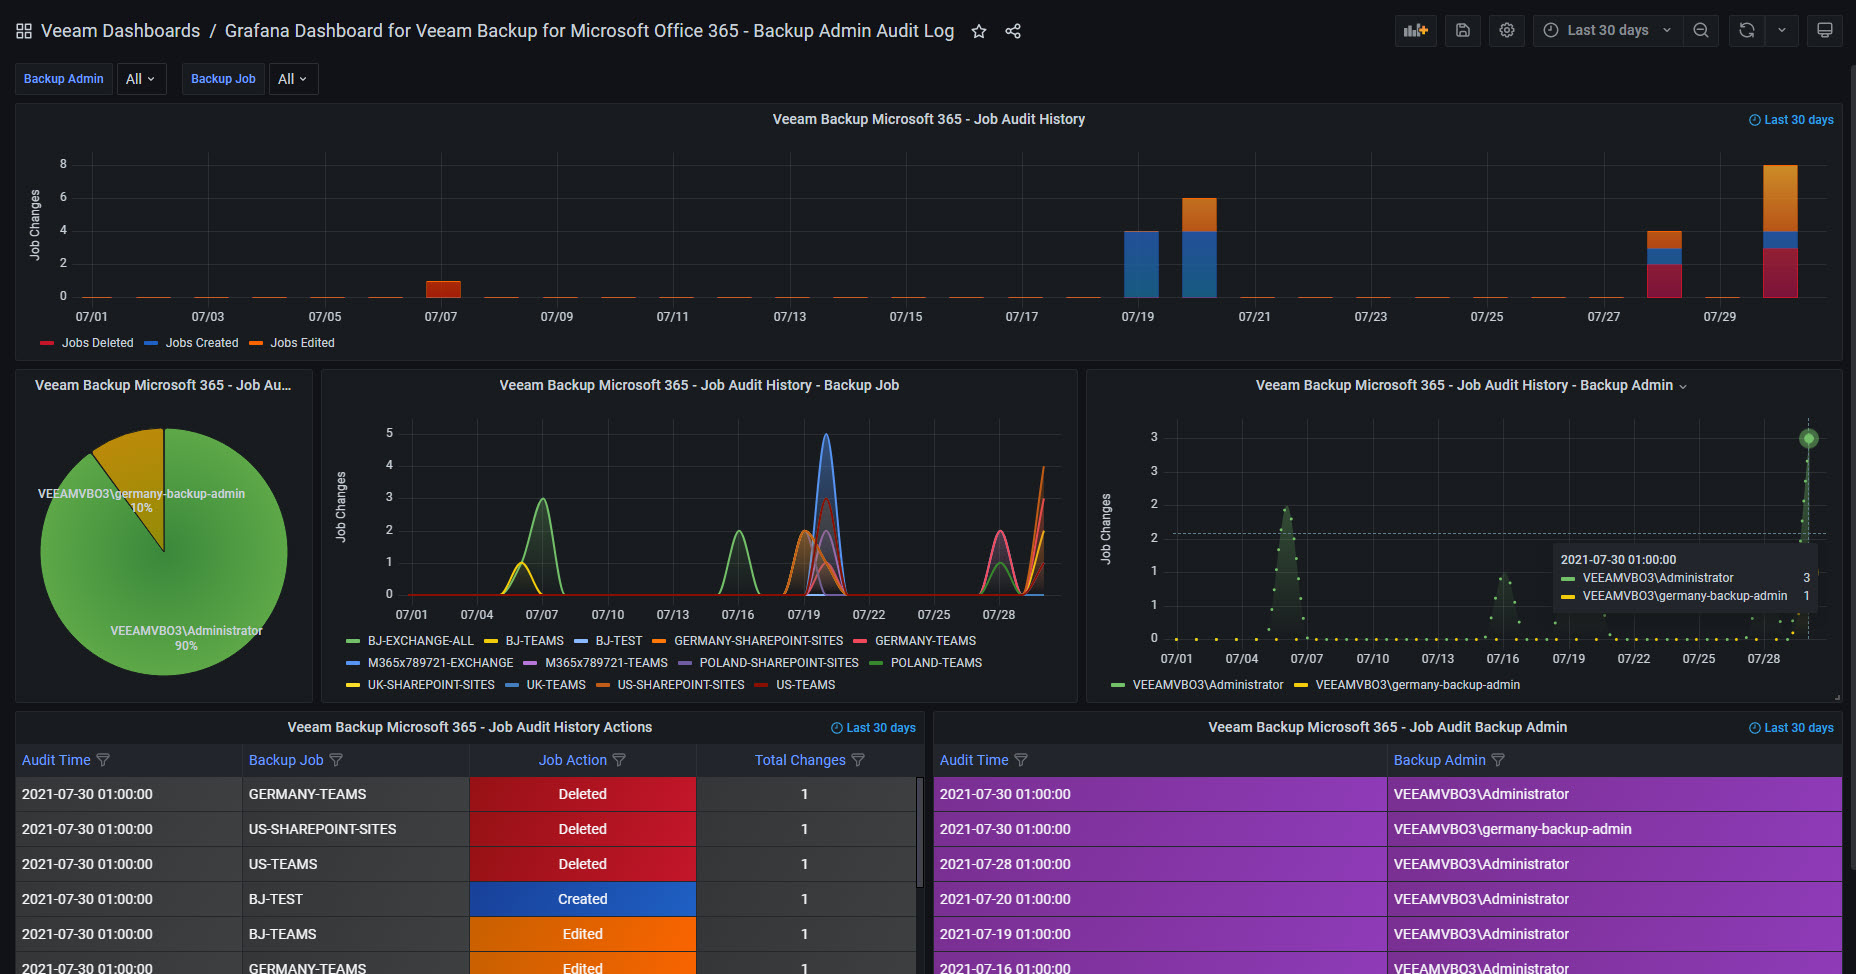
Then download or import this Dashboard to your Grafana, and you should see something similar to the next:
Data source config
Collector type:
Collector plugins:
Collector config:
Revisions
Upload an updated version of an exported dashboard.json file from Grafana
| Revision | Description | Created | |
|---|---|---|---|
| Download |
Microsoft Azure Observability
Easily visualize and alert on Microsoft Azure Service resources using the fully managed Grafana Cloud platform.
Learn more