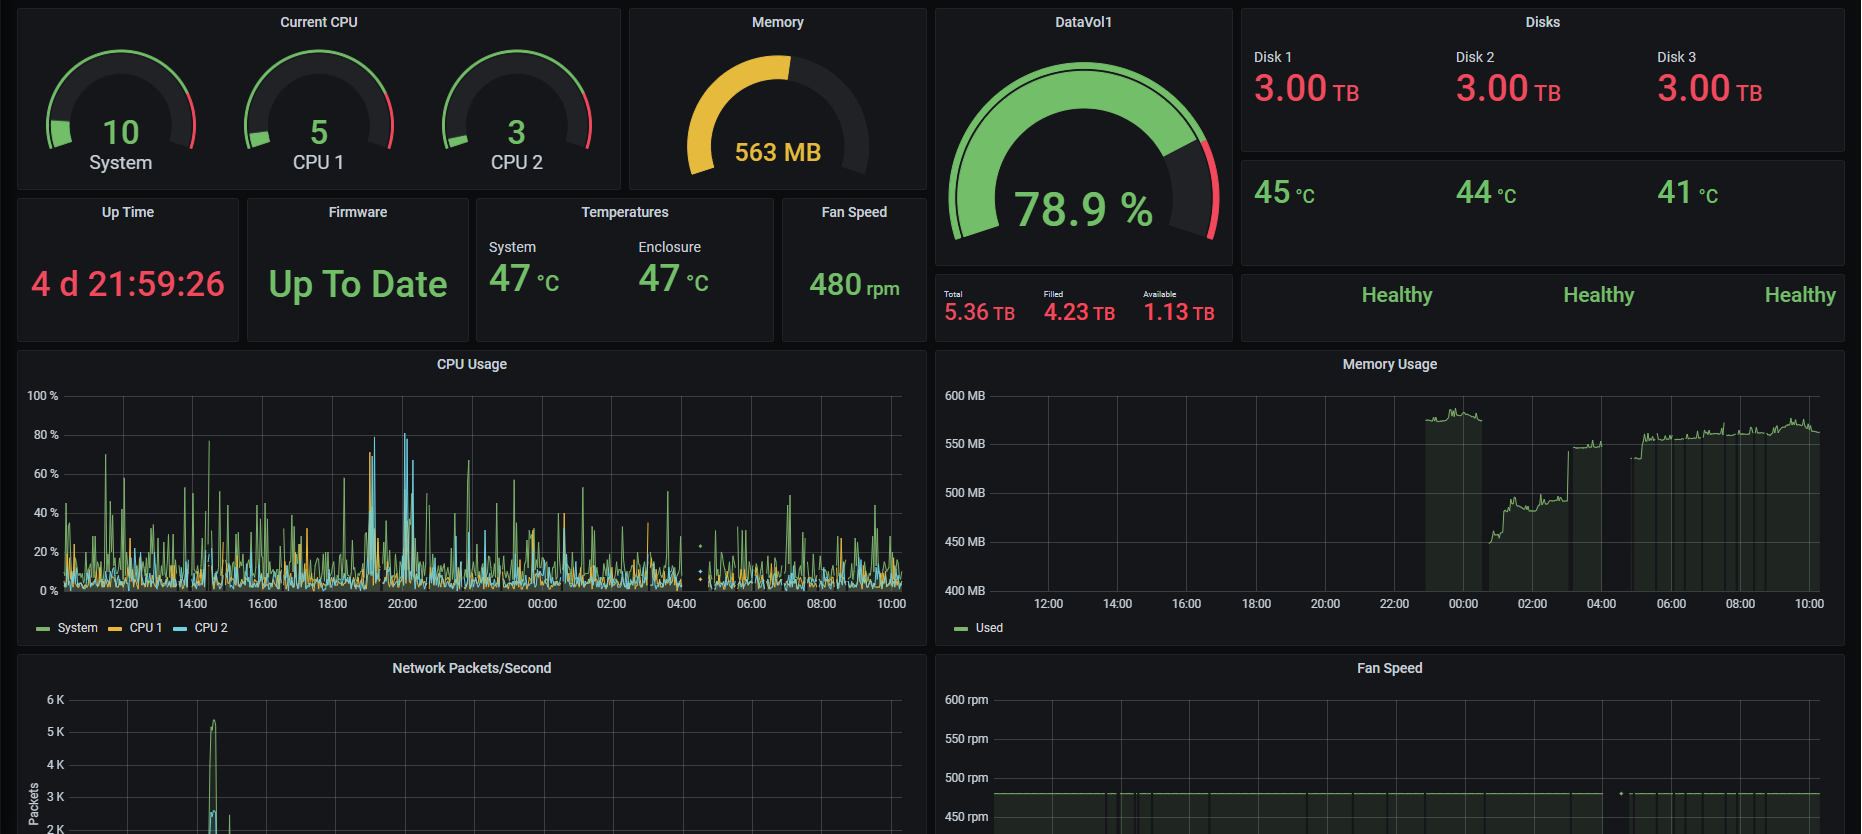
QNAP SNMP Monitor
Dashboard to monitor a QNAP NAS with SNMP
Steps
- Turn on SNMP from your QNAP device
- Generate snmp.yml to use with SNMP Exporter
- Run SNMP Exporter
- Add scrape targets to Prometheus
Use SNMP Exporter by Prometheus to export data from your SNMP device https://github.com/prometheus/snmp_exporter
Before yo use the SNMP Exporter, you have to use the SNMP generator to generate the snmp.yml to use with the exporter. To do so use SNMP Generator with the generator.yml below generator.yml
modules:
	qnap:
    	walk:
    		- cpuUsage
			- systemCPU-UsageEX
			- systemFreeMemEX
			- systemFreeMem
			- systemUsedMemory
			- systemAvailableMem
			- systemUptimeEX
			- systemTemperatureEX
			- enclosureSystemTemp
			- ifPacketsReceivedEX
			- ifPacketsSentEX
			- sysFanSpeedEX
			- sysVolumeFreeSizeEX
			- sysVolumeStatusEX
			- diskTemperture
			- diskSmartInfo
			- volumeStatus
			- iops
			- latency
	qnaplong:
		walk:
			- modelNameEX
			- hostNameEX
			- firmwareVersion
			- firmwareUpgradeAvailable
			- systemTotalMemEX
			- systemTotalMem  # V5
			- sysVolumeDescrEX
			- sysVolumeTotalSizeEX
			- diskModel
			- diskCapacity
			- volumeName
			- volumeCapacity
SNMP Generator will create snmp.yml file. Use it with the SNMP Exporter to export above SNMP data to a Prometheus friendly format.
In your Prometheus configuration file add the following two scrape targets.
- job_name: 'snmp_qnap'
scrape_interval: 1m
scrape_timeout: 1m
static_configs:
- targets:
- 192.168.1.5 #IP Address of the SNMP Device
metrics_path: /snmp
params:
module: [qnap]
relabel_configs:
- source_labels: [__address__]
target_label: __param_target
- source_labels: [__param_target]
target_label: instance
- target_label: __address__
replacement: 192.168.1.15:9116 #IP Address of the SNMP Exporter. 9116 is the default port
- job_name: 'snmp_qnap_long'
scrape_interval: 5m
scrape_timeout: 2m
static_configs:
- targets:
- 192.168.1.5 #IP Address of the SNMP Device
metrics_path: /snmp
params:
module: [qnaplong]
relabel_configs:
- source_labels: [address]
target_label: __param_target
- source_labels: [__param_target]
target_label: instance
- target_label: address
replacement: 192.168.1.15:9116 #IP Address of the SNMP Exporter. 9116 is the default port
Works Best with
- One data volume
Known Issues
- If it says "No Data" in some fields, it means one of two scrapes failed. Data will be back when the scrape succeeds.
Data source config
Collector config:
Upload an updated version of an exported dashboard.json file from Grafana
| Revision | Description | Created | |
|---|---|---|---|
| Download |
SNMP
Easily monitor any generic SNMP (Simple Network Management Protocol) device with Grafana Cloud's out-of-the-box monitoring solution.
Learn more
