WebSphere Application Server PMI Metrics OpenShift Dashboard
Visualize PMI metrics data for your WebSphere Application Server on OpenShift
Starting in WebSphere Application Server 9.0.5.7 the IBM WebSphere team introduced a new capability where the statistical MBean data gathered by Performance Monitoring Infrastructure (PMI) is collected to produce metrics in Prometheus exposition format. This new capability allows the WebSphere Application Server topology to be monitored effectively using Prometheus and Grafana.
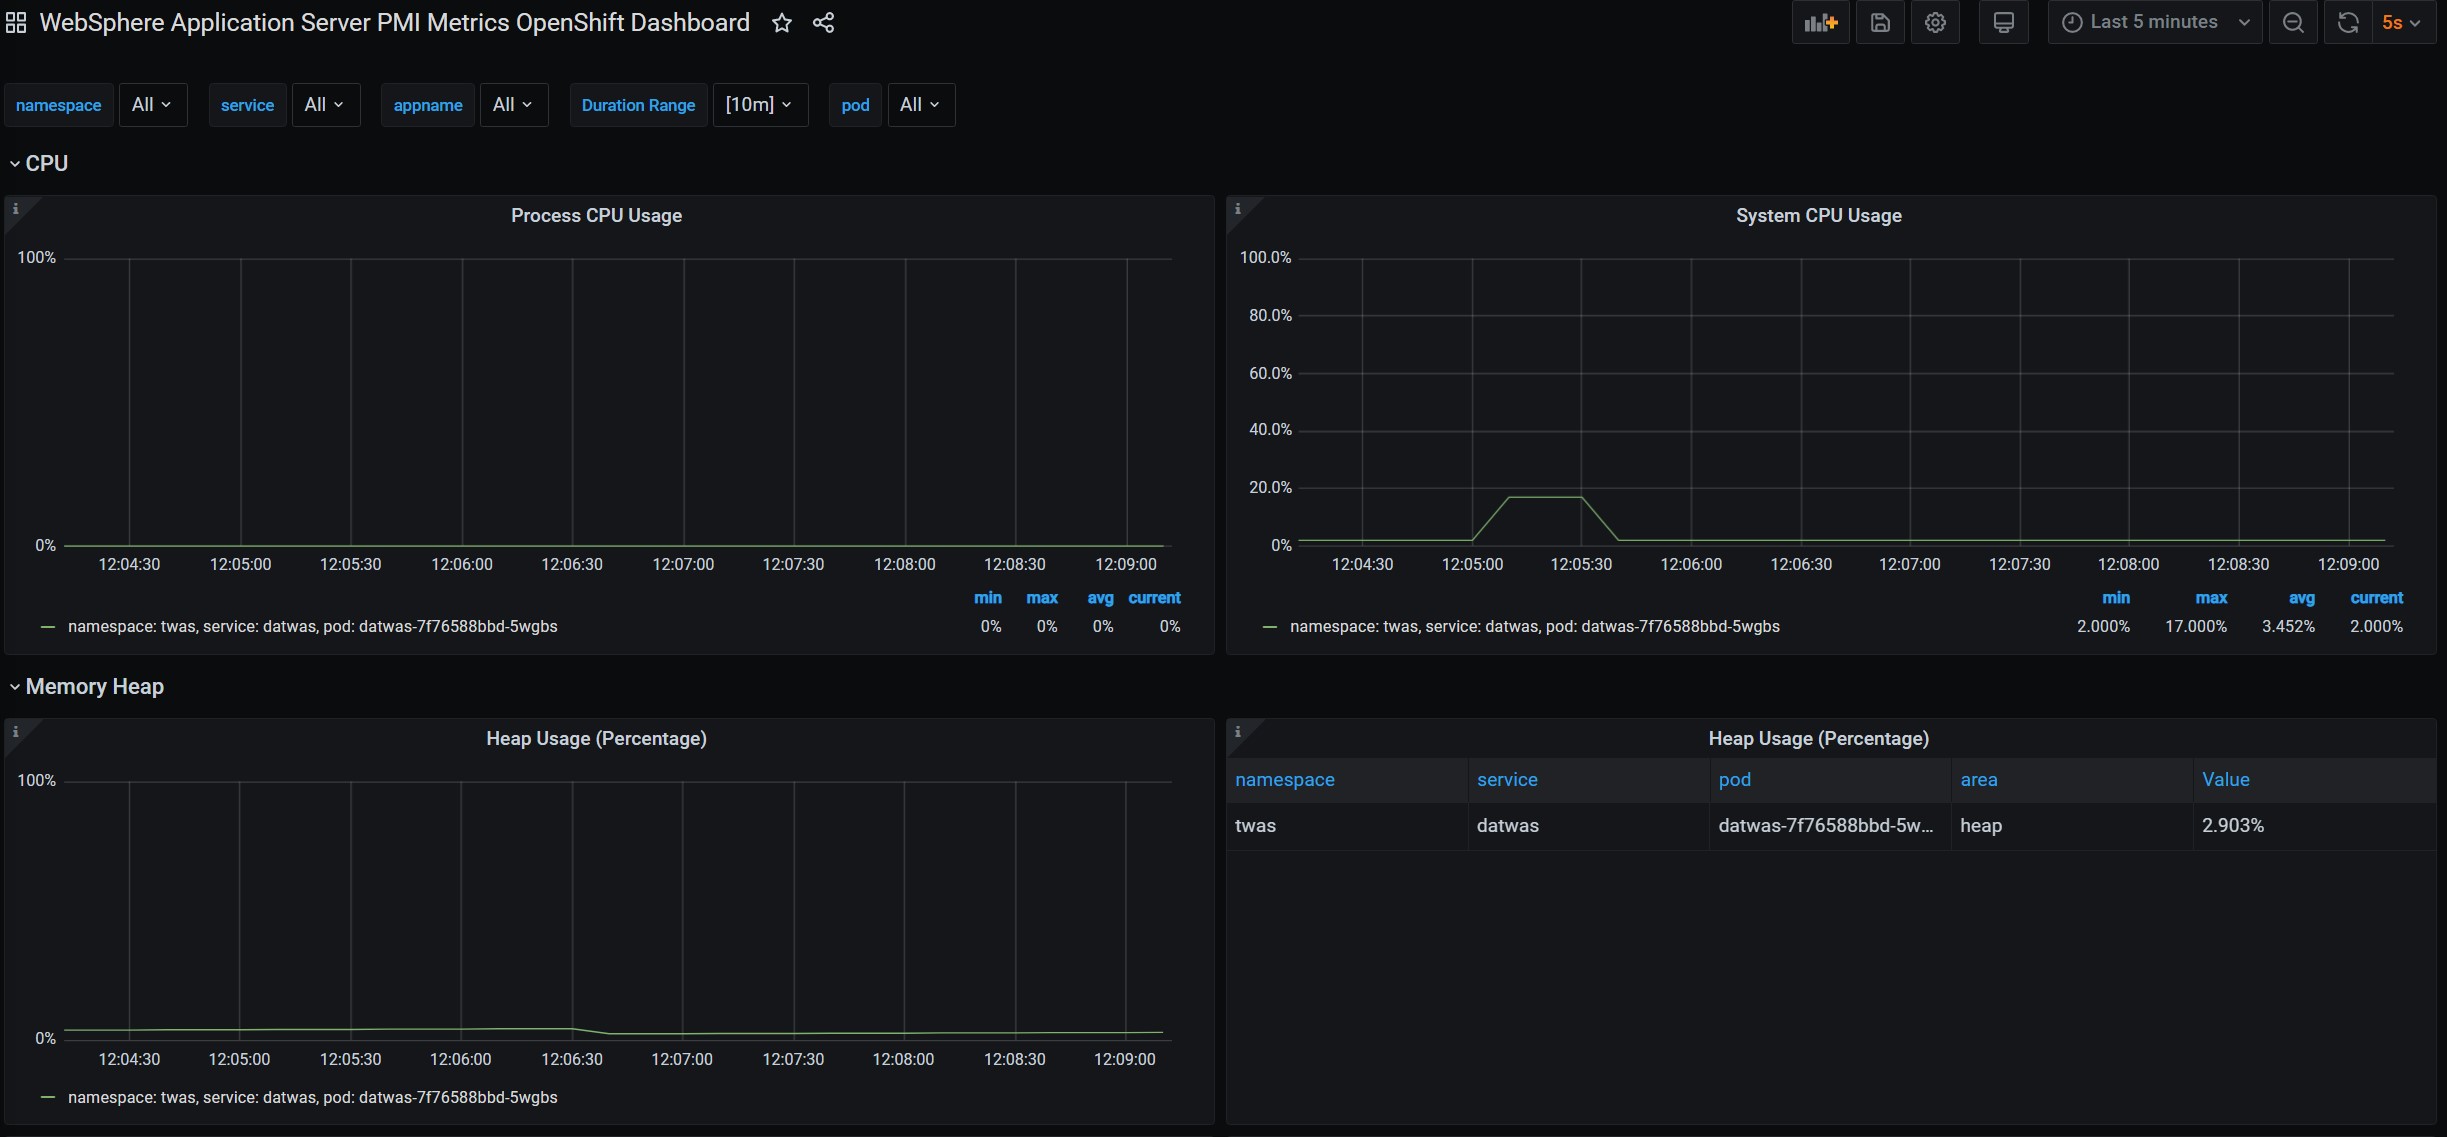
This dashboard leverages the Prometheus formatted metric data to visualize CPU, Memory Heap, Servlets, EJBs, Connection Pool, SIB, Sessions, Threadpool, Garbage Collection, and other JVM metrics of the entire cell.
This dashboard has been tested with the version 7.3.10 of Grafana provided by the Grafana Operator.
## WebSphere Application Server: To use this Grafana dashboard the WebSphere Application Server docker image deployed on OCP will need to have the metrics.ear deployed, GC profiler for the JVM configured (for the GC stats!) and have the PMI settings configured to specifically output the stats/metrics used by this Grafana dashboard.
- Provided below is the Dockerfile to build the customized WAS image and the required files/scripts for building the image.
- After building the image push it to the image registry of your choice and deploy it as an instance of the Runtime Component Operator
- You will then need to deploy Prometheus and Grafana on your OpenShift cluster and configure it to scrape metrics from your target service/deployment outlined at Application Monitoring on Red Hat OpenShift Container Platform (RHOCP) with Prometheus and Grafana. The documentation may be under the Open Liberty Operator repository , but the instructions for configuring Prometheus and Grafana are applicable here.
- Learn more about the WebSphere Performance Monitoring Infrastructure
- Learn more about the WebSphere docker image on Docker Hub
- Learn more about the WebSphere docker image and configuration options on its Github repository
- See the full list of Prometheus Metrics
Dockerfile
FROM ibmcom/websphere-traditional:latest as base
FROM ibmcom/websphere-traditional:latest
COPY --from=base --chown=was:root /opt/IBM/WebSphere/AppServer/installableApps/metrics.ear /work/config/metrics.ear
COPY --chown=was:root install_app.py /work/config/
COPY --chown=was:root setPMI.py setGCProfiler.py /work/
COPY was-config.props /work/config/was-config.props
RUN env JVM_EXTRA_CMD_ARGS=-Xnoloa /work/configure.sh && /work/configure.sh /work/setGCProfiler.py && /work/configure.sh /work/setPMI.py
installApp.py
import sys
import os
global  AdminConfig
def getNodeId (prompt):
    nodeList = AdminConfig.list("Node").split("\n")
    if (len(nodeList) == 1):
        node = nodeList[0]
    else:
        print ""
        print "Available Nodes:"
        nodeNameList = []
        for item in nodeList:
            item = item.rstrip()
            name = getName(item)
            nodeNameList.append(name)
            print "   " + name
        DefaultNode = nodeNameList[0]
        if (prompt == ""):
            prompt = "Select the desired node"
        nodeName = getValidInput(prompt+" ["+DefaultNode+"]:", DefaultNode, nodeNameList )
        index = nodeNameList.index(nodeName)
        node = nodeList[index]
    return node
def getServerId (prompt):
    serverList = AdminConfig.list("Server").split("\n")
    if (len(serverList) == 1):
        server = serverList[0]
    else:
        print ""
        print "Available Servers:"
        serverNameList = []
        for item in serverList:
            item = item.rstrip()
            name = getName(item)
            serverNameList.append(name)
            print "   " + name
        DefaultServer = serverNameList[0]
        if (prompt == ""):
            prompt = "Select the desired server"
        serverName = getValidInput(prompt+" ["+DefaultServer+"]:", DefaultServer, serverNameList )
        index = serverNameList.index(serverName)
        server = serverList[index]
    return server
def getName (objectId):
    endIndex = (objectId.find("(c") - 1)
    stIndex = 0
    if (objectId.find(""") == 0):
        stIndex = 1
    return objectId[stIndex:endIndex+1]
print "Installing application …"
node = getName(getNodeId(""))
server = getName(getServerId(""))
parms = "-appname Application"
parms += " -node " + node + " -server " + server
parms += " -nouseMetaDataFromBinary"
app = AdminApp.install("/work/config/metrics.ear", [parms])
AdminTask.setGenericJVMArguments('[-nodeName ' + node + ' -serverName ' + server + ' -genericJvmArguments "-Xnoloa"]')
AdminConfig.save()
was-config.props
ResourceType=ThreadPool
ImplementingResourceType=Server
ResourceId=Cell=!{cellName}:Node=!{nodeName}:Server=!{serverName}:ThreadPoolManager=:ThreadPool=
maximumSize=100
name=WebContainer
minimumSize=100
inactivityTimeout=60000
setGCProfiler.py
# -*- coding: utf-8 -*-
def main():
    #Goes through each node
    for node in AdminConfig.list('Node').split():
        #Acquire node name
        nodeName = AdminConfig.showAttribute(node, 'name')
        for server in AdminControl.queryNames("type=Server,node="+ nodeName + ",*").split():
            #Acquire server name
            serverName = AdminControl.getAttribute(server, 'name')
            print("serverName " + serverName)
            #Instrument JVM profiler
            AdminTask.setJVMProperties('[-nodeName ' + nodeName + ' -serverName ' + serverName + ' -genericJvmArguments "-agentlib:pmiJvmtiProfiler"]')
            AdminConfig.save()
            print("Finished instrumenting GC profiler")
if name == "main":
    main()
setPMI.py
# -*- coding: utf-8 -*-
def main():
    #Enables all specified attributes
    customString = [append(), java.lang.Boolean ('true')]
    #Goes through each node
    for node in AdminConfig.list('Node').split():
        nName = AdminConfig.showAttribute(node, 'name')
        #Makes sure to not include the cell manager nodes
        for server in AdminControl.queryNames("type=Server,node="+ nName + ",").split():
            #This obtains the Performance Mbean object.
            #First it gets the MBean name (i.e perfStr)
            #SEcond it obtains the Mbean Object (I.e perfObj)
            processName = AdminControl.getAttribute(server, 'name')
            perfStr = AdminControl.queryNames("type=Perf,process=" + processName + ",node=" + nName + ",")
            perfObj = AdminControl.makeObjectName(perfStr)
            print("configuring:" + processName + ". From: " + nName)
            invoke(perfStr, perfObj, customString)
            print("done")
#Below is how you would ENABLE or DISABLE specific PMI stats/attributes.
#The attribute IDs/Numbers are derived from: https://www.ibm.com/support/knowledgecenter/en/SSAW57_9.0.5/com.ibm.websphere.nd.multiplatform.doc/ae/rprf_datacounter14.html
def append():
    string ='servletSessionsModule=6,1,2,7'
    string+=':beanModule=11,12'
    string+=':webAppModule=11,13'
    string+=':threadPoolModule=3,8,6,4,7'
    string+=':StatGroup.SIBService=8,14'
    string+=':StatGroup.SIBService>StatGroup.Communications>StatGroup.Clients>StatGroup.ClientsStandard=563,562'
    string+=':StatGroup.SIBService>StatGroup.Communications>StatGroup.MessagingEngines>StatGroup.MessagingEnginesStandard='
    string+=':StatGroup.SIBService>StatGroup.SIBMessagingEngines=513,512'
    string+=':systemModule=1,2,3'
    string+=':j2cModule=2,15,1,6,14,12,13,7'
    string+=':connectionPoolModule=2,15,1,6,14,12,13,7'
    string+=':jvmRuntimeModule=1,2,3,4,5,11,12,13'
    string+=':beanModule=11,12'
    return string
def invoke(perfStr, perfObj, customString):
    sigs = ['java.lang.String', 'java.lang.Boolean']
    AdminControl.invoke_jmx (perfObj, 'setCustomSetString', customString, sigs)
    AdminControl.invoke(perfStr,'savePMIConfiguration')
if name == "main":
    main()
Data source config
Collector config:
Upload an updated version of an exported dashboard.json file from Grafana
| Revision | Description | Created | |
|---|---|---|---|
| Download |