
Jenkins Monitoring
Jobs queue speeds and rates, Executors availability, Nodes status, Jenkins and JVM resource usage, Jenkins Job Status, and lot more.
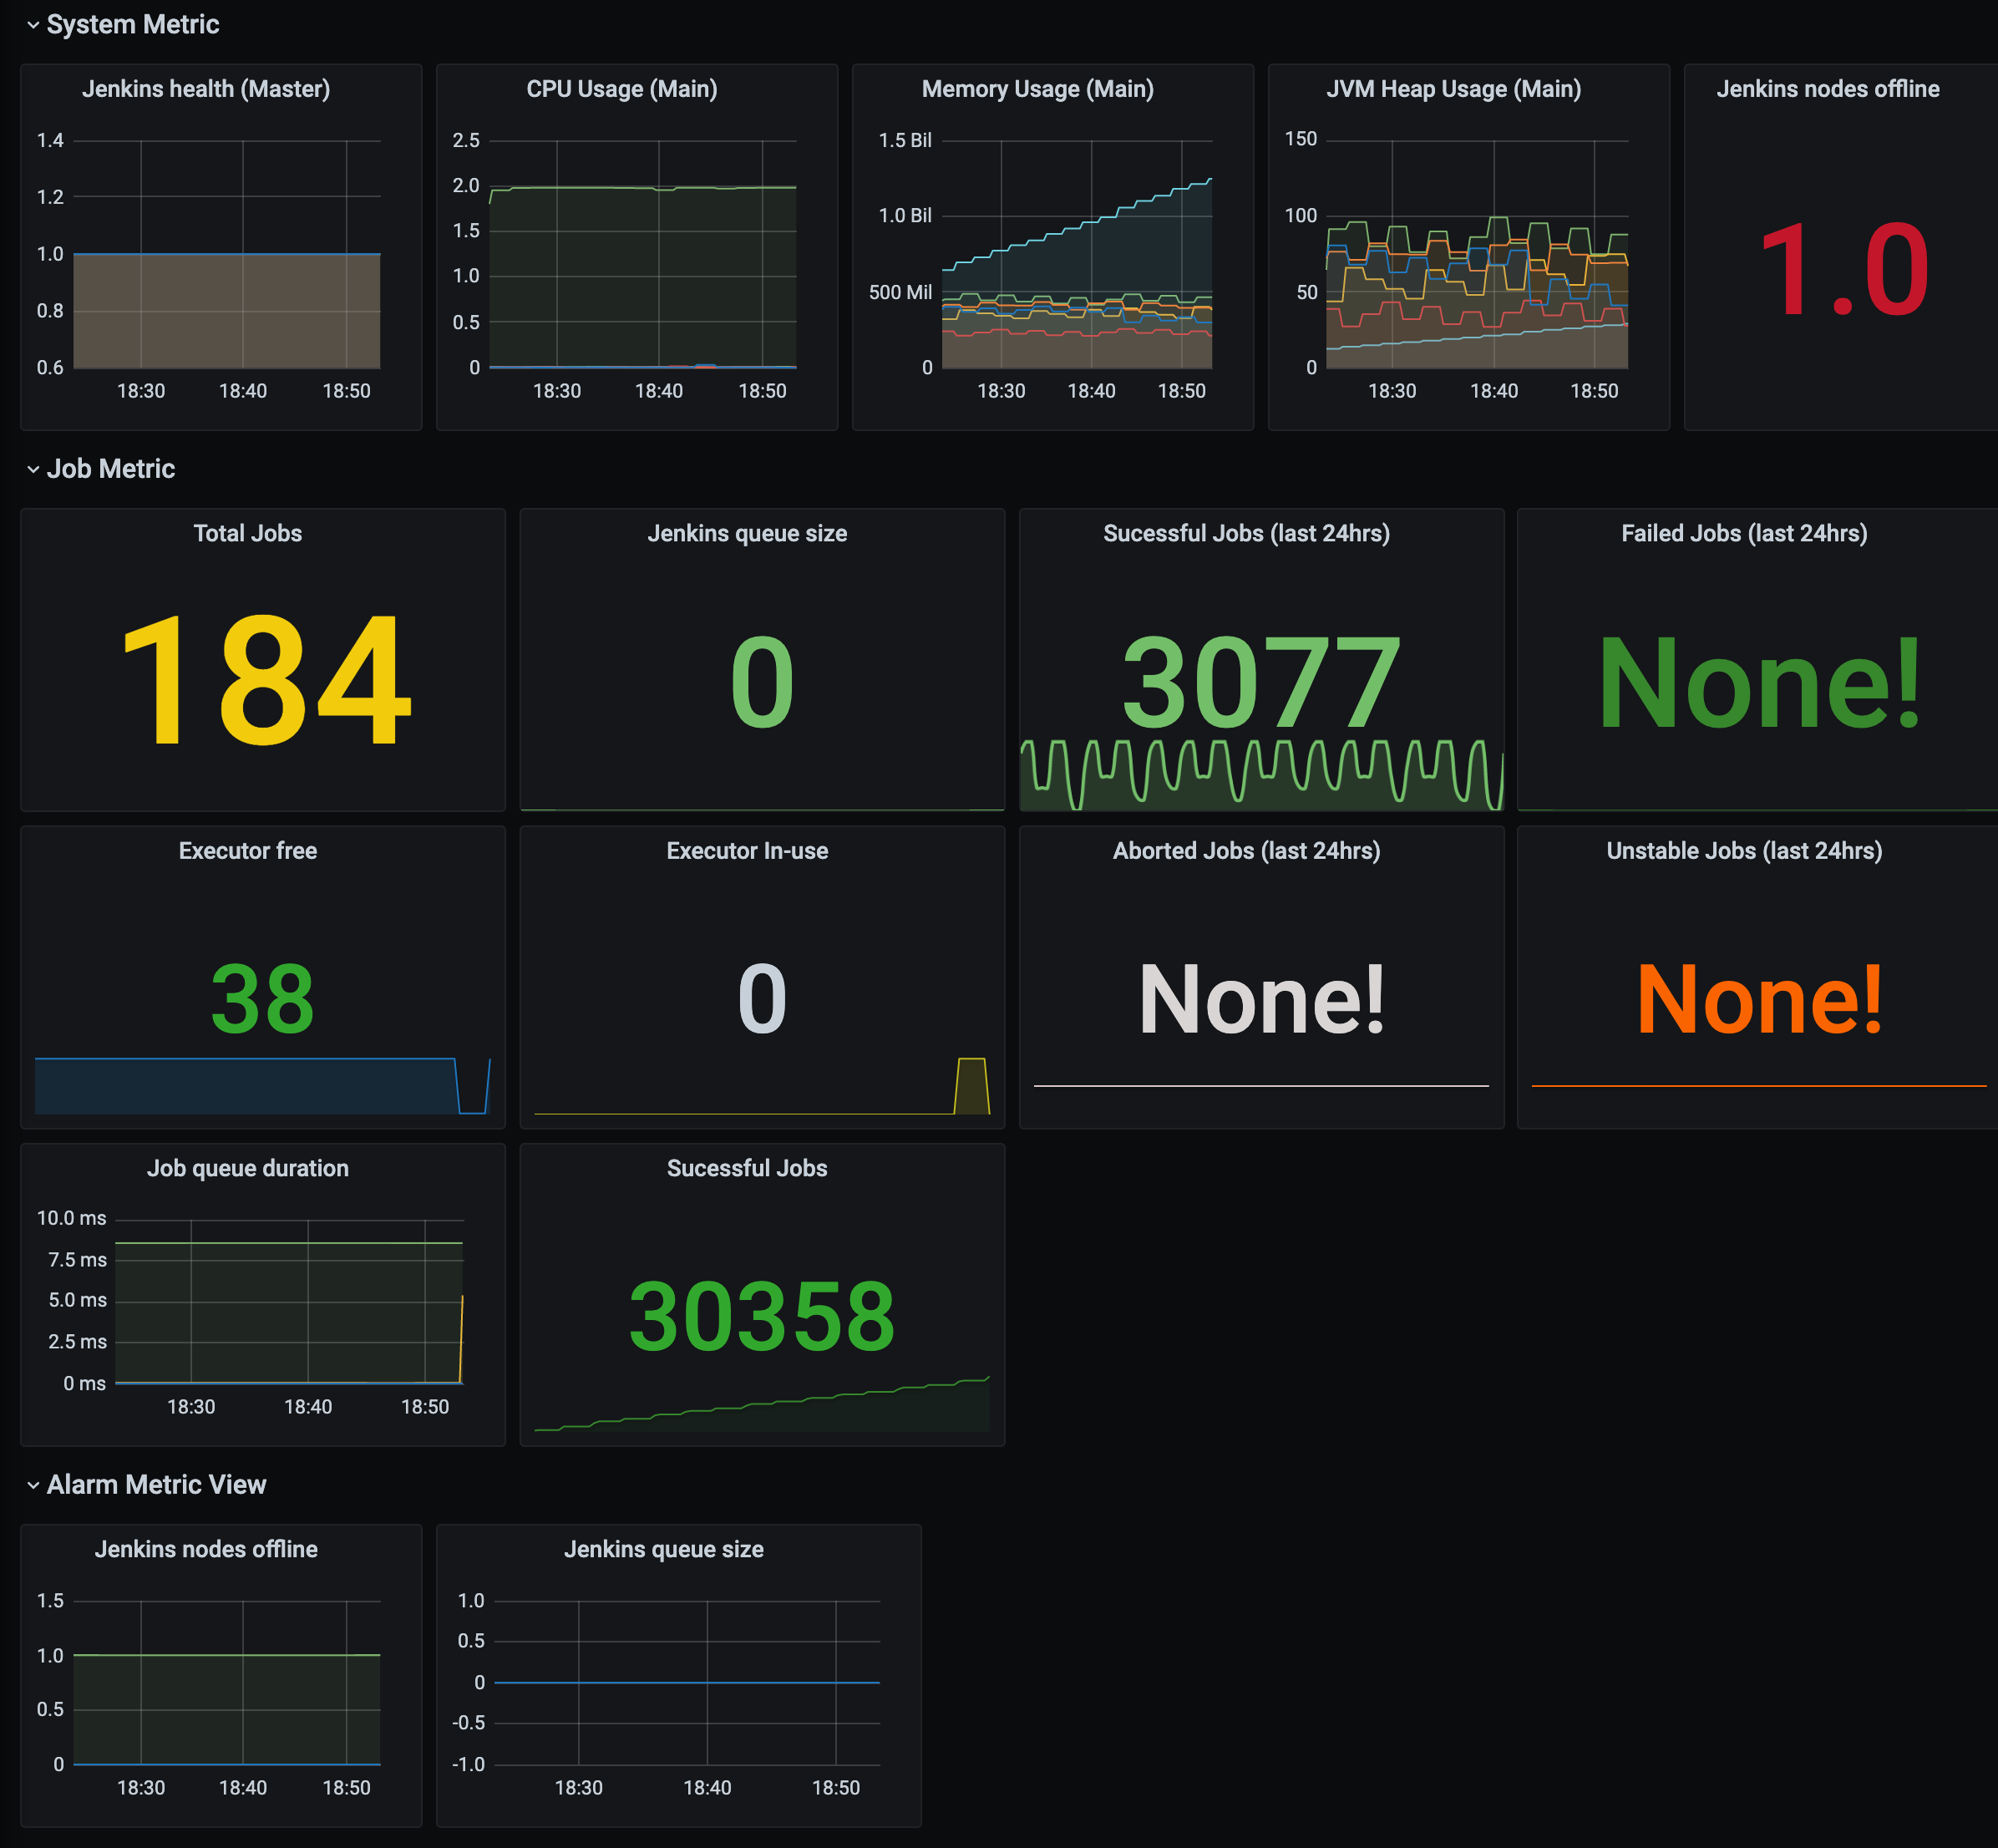
여러대의 Jenkins 를 하나의 Dashboard 에서 모니터링할 수 있도록 구성함. Jenkins 에는 Prometheus metrics plugin 설치를 하고, Prometheus 의 scrape 설정을 추가하여 metric 수집 후 Grafana dashboard 에 시각화 함.
Data source config
Collector type:
Collector plugins:
Collector config:
Revisions
Upload an updated version of an exported dashboard.json file from Grafana
| Revision | Description | Created | |
|---|---|---|---|
| Download |
Jenkins
Easily monitor your deployment of Jenkins, the open source automation server, with Grafana Cloud's out-of-the-box monitoring solution.
Learn more