Windows Exporter Node
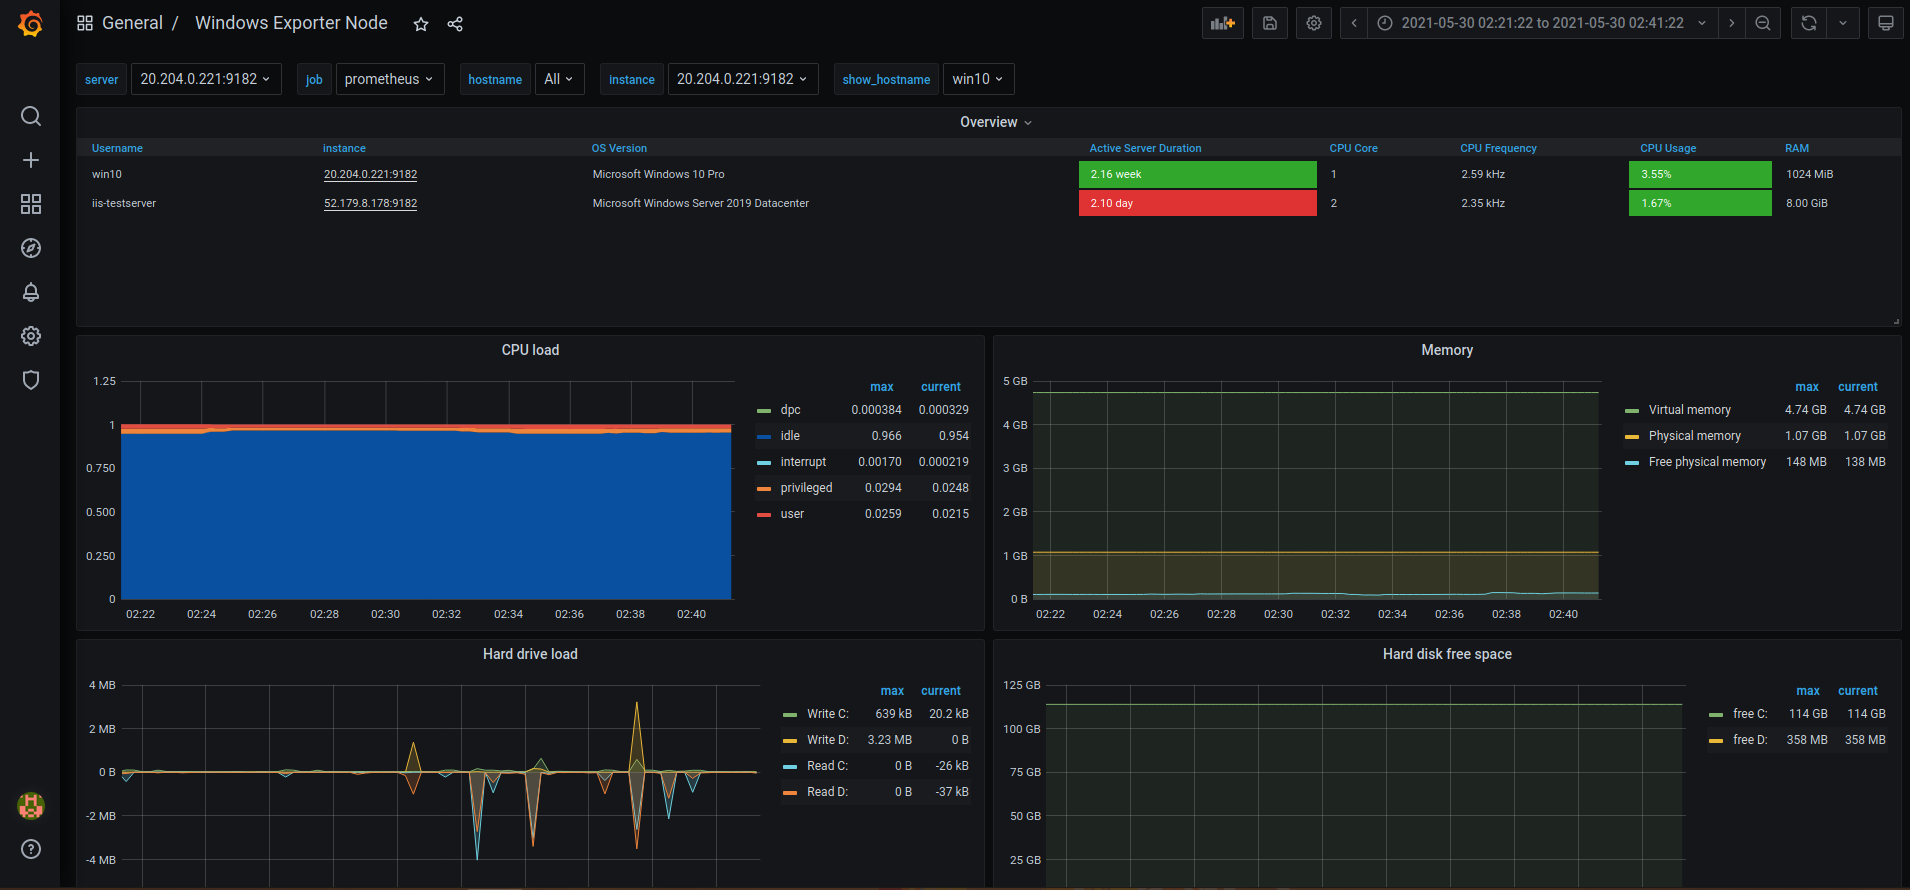
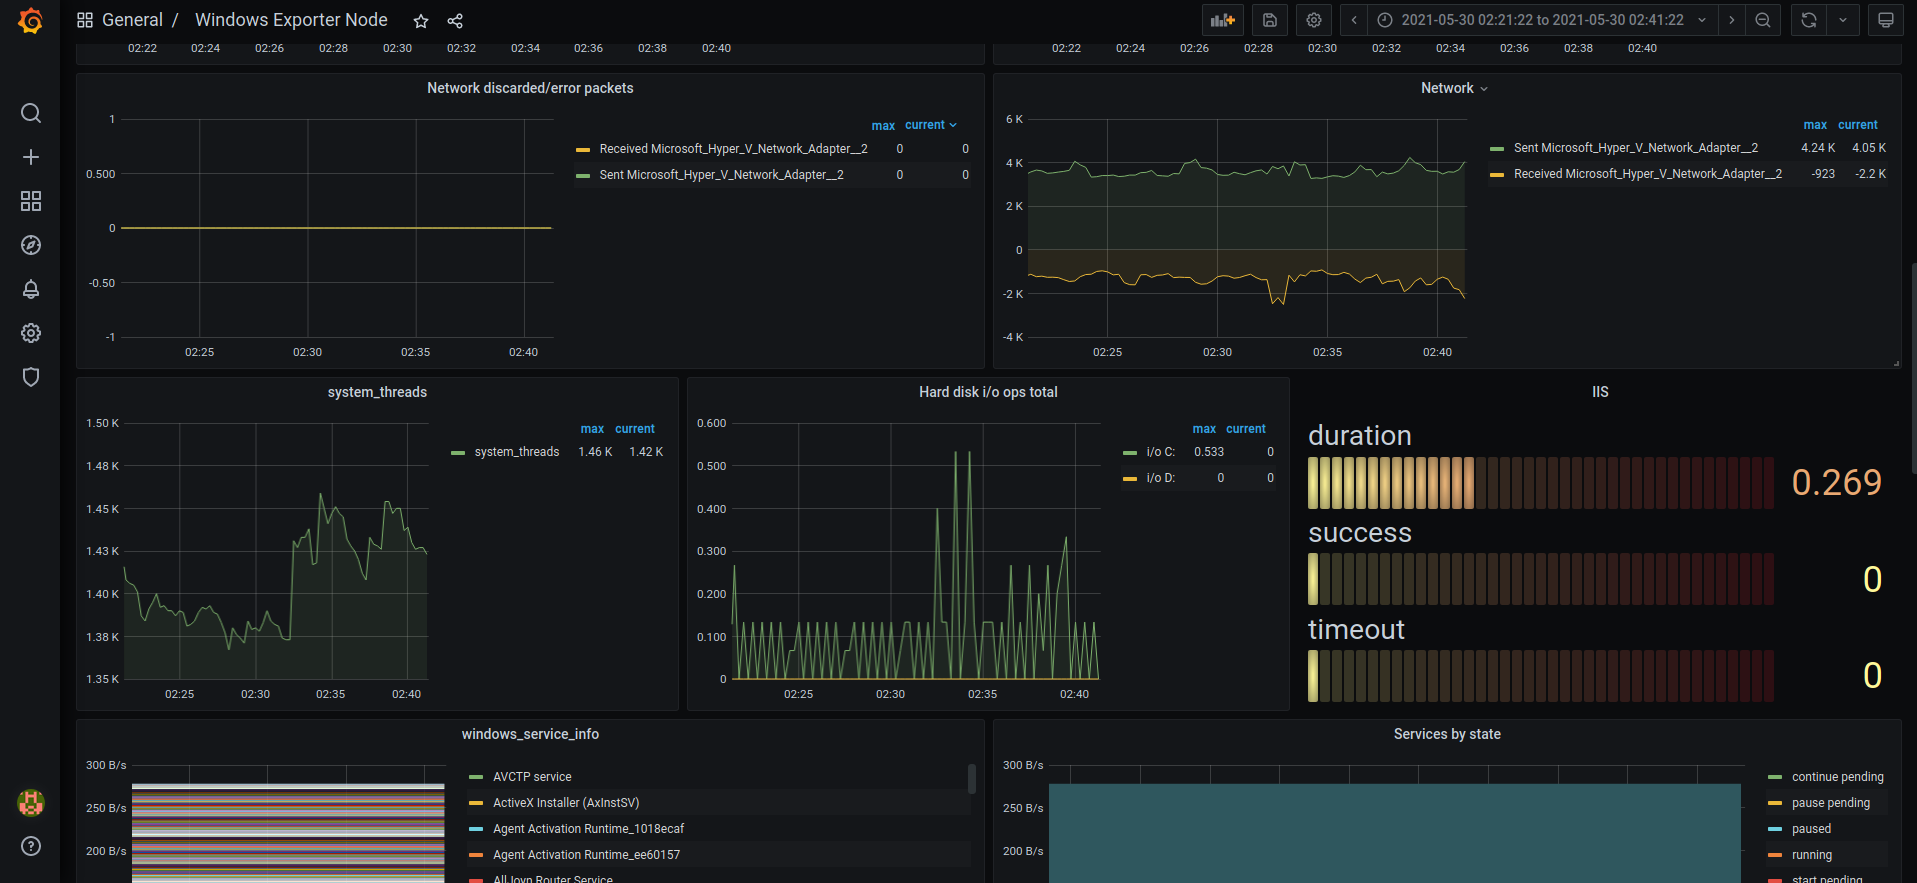
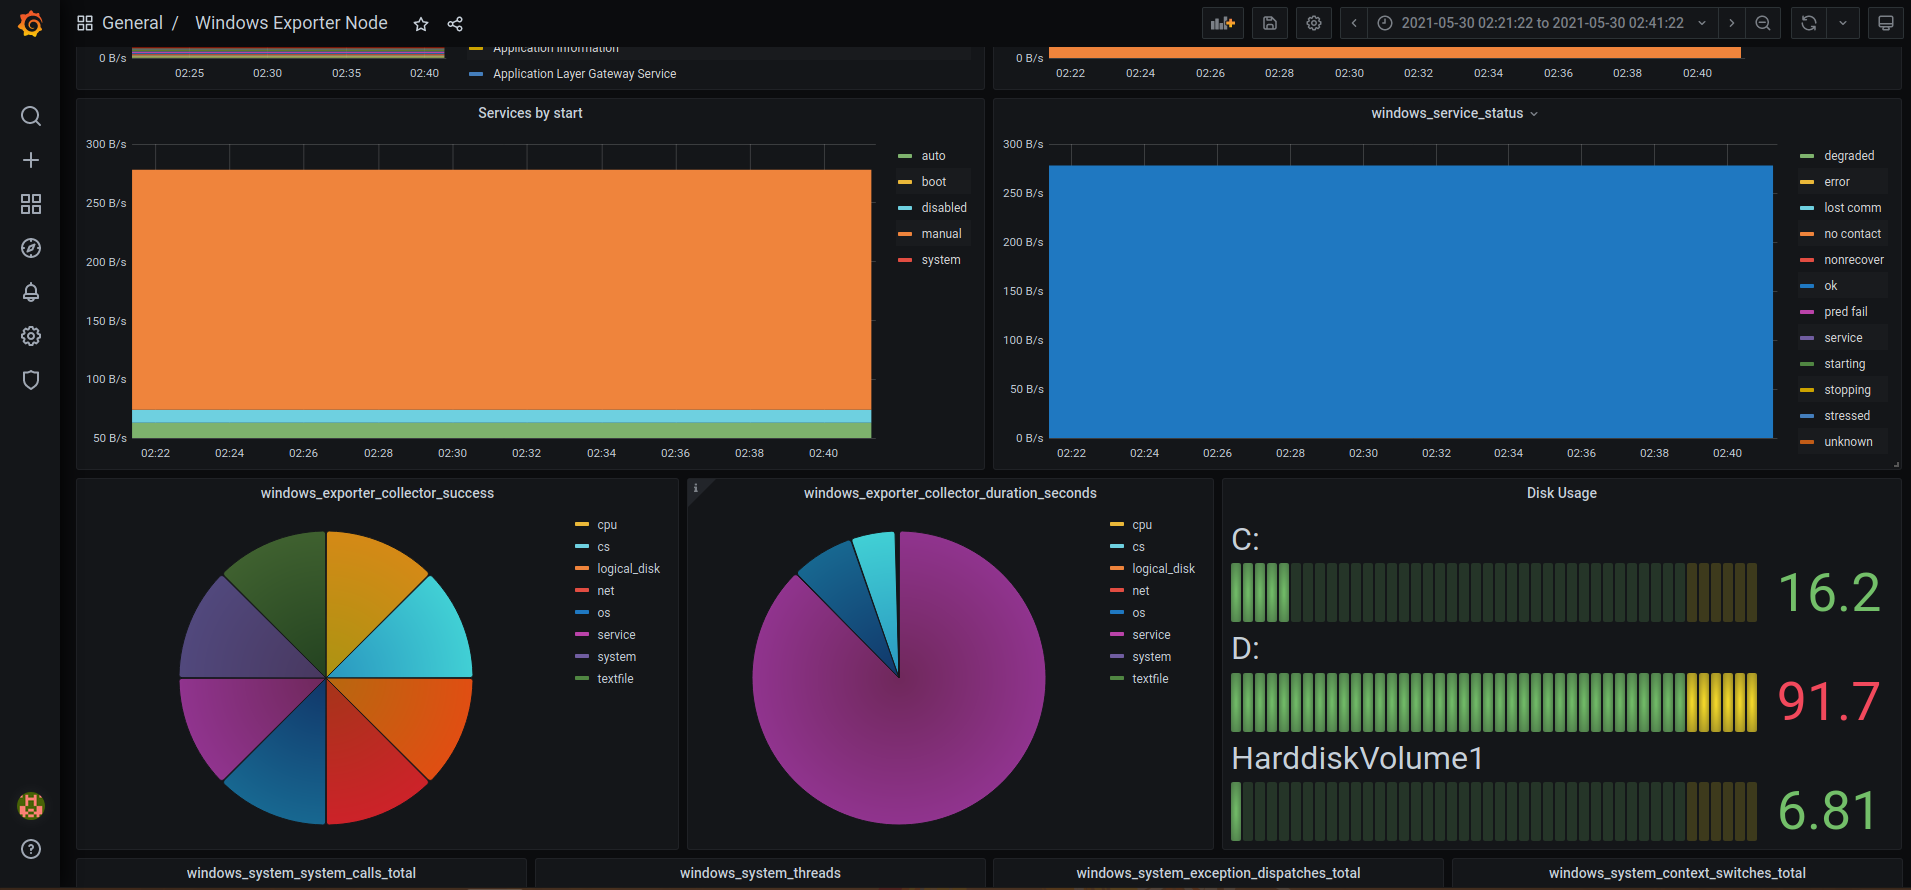
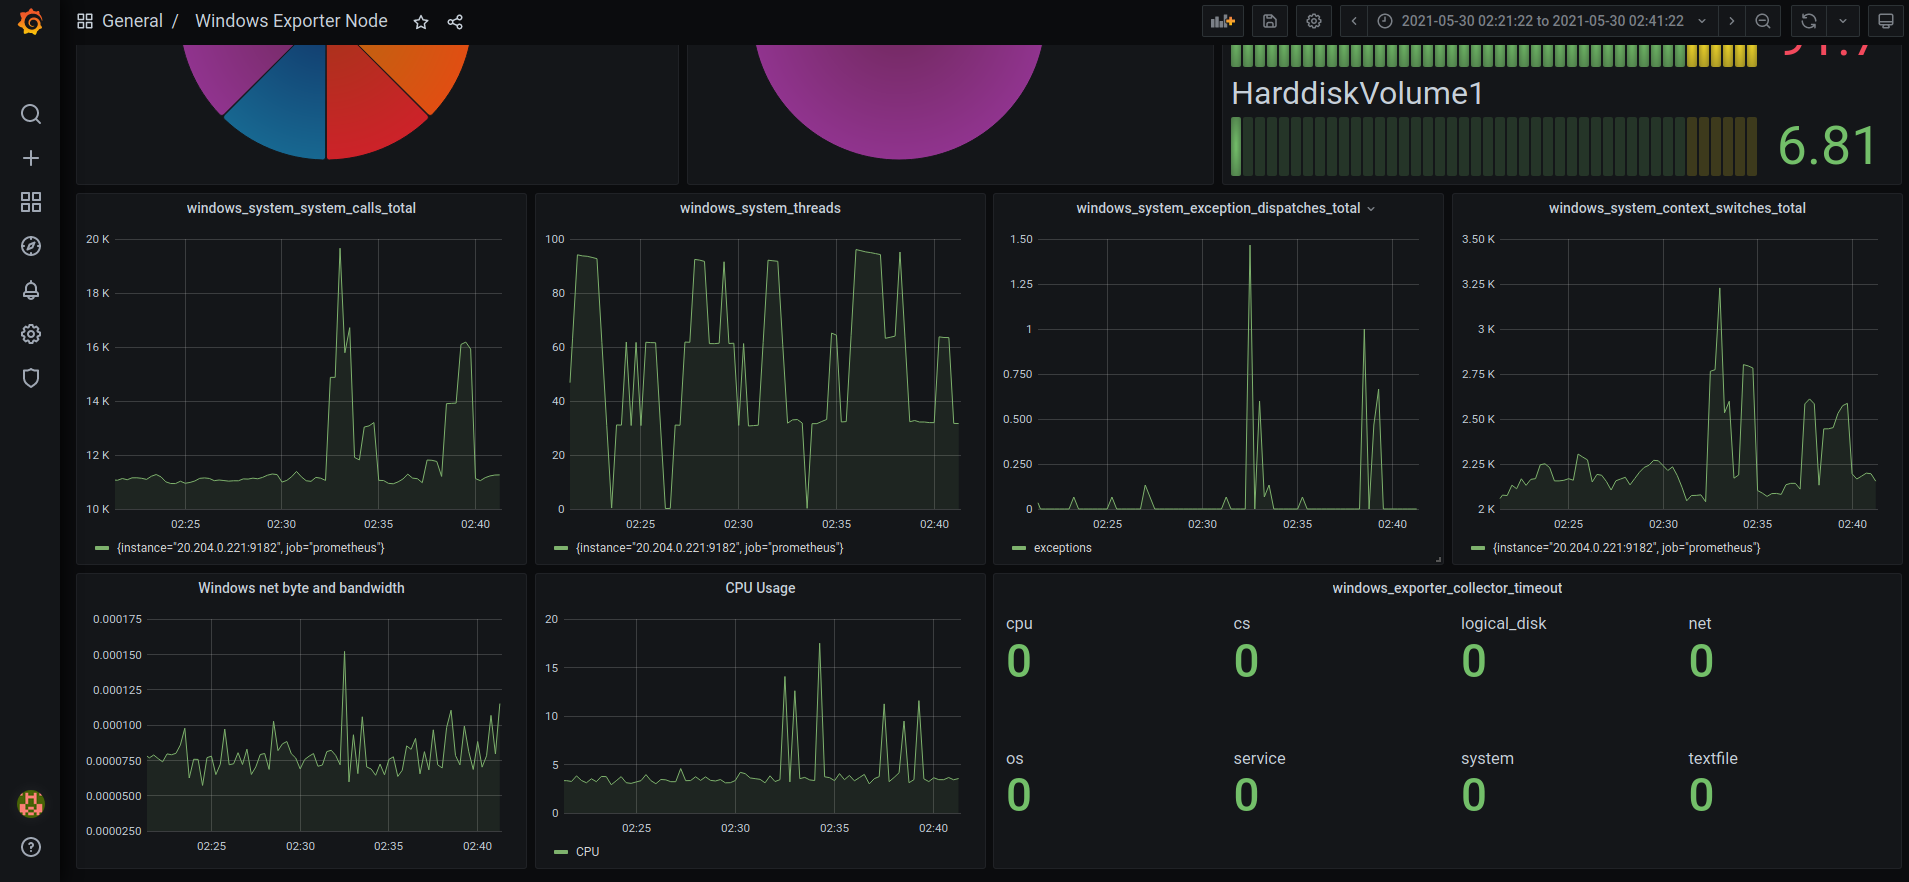
General stats dashboard with node selector, uses metrics from windows_exporter
To use this dashboard you will require Prometheus, windows_exporter as of May 2021.
Link for windows_exporter : https://github.com/prometheus-community/windows_exporter
Data source config
Collector config:
Upload an updated version of an exported dashboard.json file from Grafana
| Revision | Description | Created | |
|---|---|---|---|
| Download |
Linux Server
Monitor Linux with Grafana. Easily monitor your Linux deployment with Grafana Cloud's out-of-the-box monitoring solution.
Learn more


