Pi-hole UI
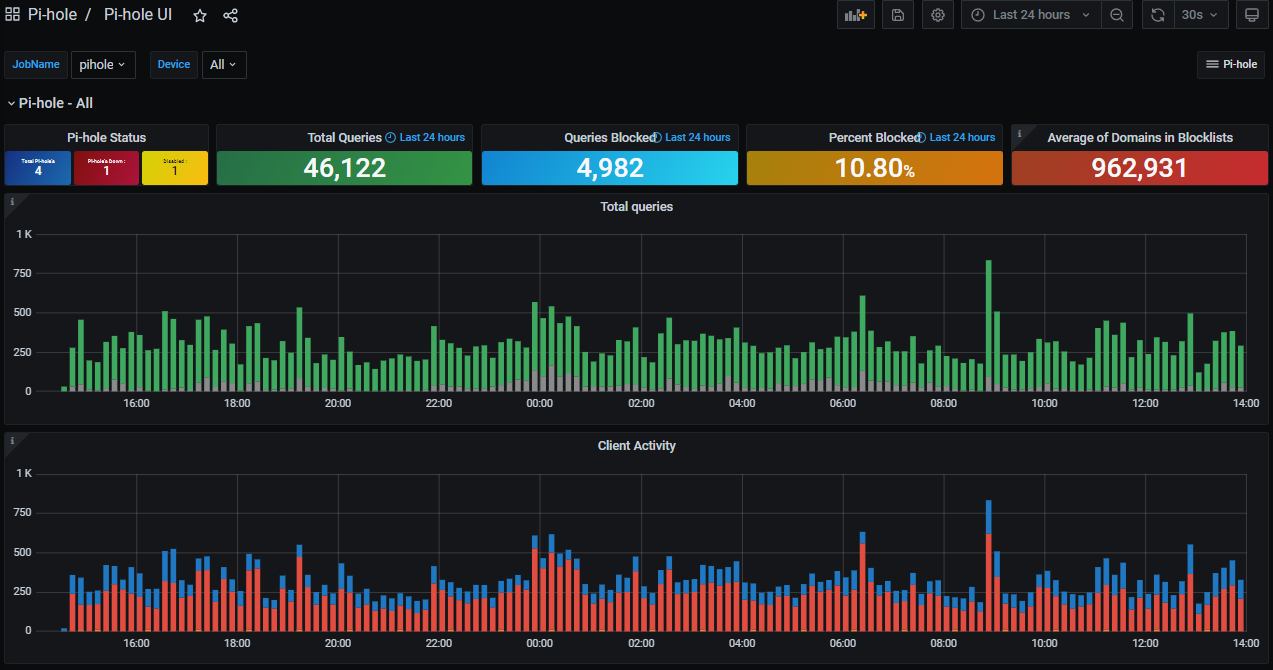
Watch either a single Pi-hole system or combine the statics of several in a single pane.
This dashboard was built around the pihole-exporter https://github.com/eko/pihole-exporter.
With this dashboard you can see the statics and status of either a single Pi-hole instance or combine statistics across multiple Pi-hole servers.
PiholeDevices is a variable you will need to update with the total number of Pi-hole systems you have in Prometheus. Setting this number helps to identify when a Pi-hole server in your environment is either down or not being scrapped. You should be prompted to enter the number of Pi-hole devices when you import the dashboard.
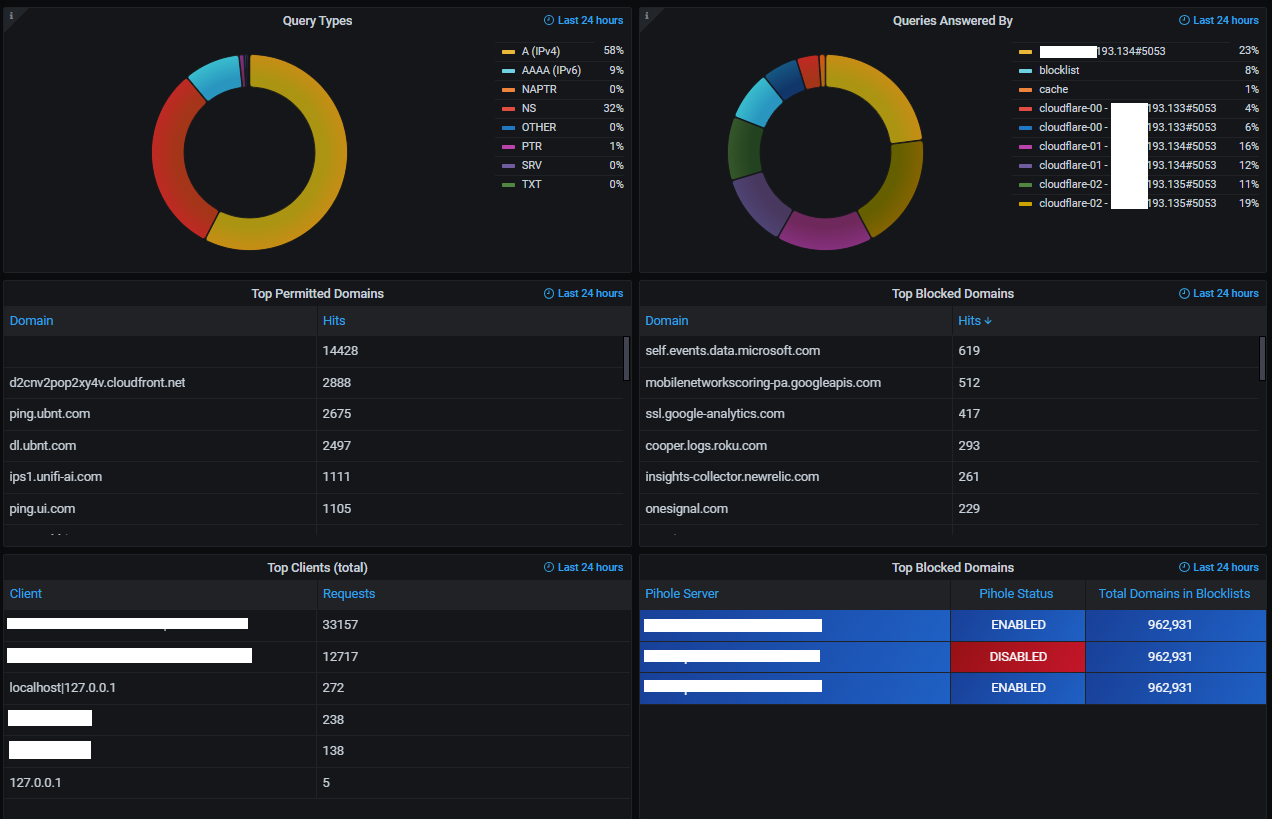
QueryTypes allows you to tune the Query Types panel to only show you the types you are interested in. It’s a simple exclude so if you don’t care about things like MX records you can simply put that in the Regex and it won’t show up on the dashboard.
If you currently don’t have any data in Prometheus please note that it may take 20 minutes before you see anything in some of the graphs once the data starts coming in. This is because it uses a delta between the previous 10 minute poll and the most recent poll to calculate the data.
Pi-hole Status pain will provide additional information if there is an issue with one of your Pi-hole servers. If you put a device into maintenance or a server becomes unreachable an additional box will show up indicating the number of issues. If a new device is added but you don’t update the PiholeDevices variable you will also get a box indicating you have more Pi-hole devices than the variable is set to. (see the image for reference)
Average of Domains in Blocklists adds the value of all servers in the environment and then divides that sum by the number of Pi-hole devices selected to get an average. If all your Pi-hole server have the same number of domains in their blocklists then this shouldn’t be a problem as the average will match.
Pi-hole Server Information provides a list of all the Pi-hole servers regardless of the JobName or device you have selected at the top.
Data source config
Collector config:
Upload an updated version of an exported dashboard.json file from Grafana
| Revision | Description | Created | |
|---|---|---|---|
| Download |
Raspberry Pi
Easily monitor Raspberry Pi, the small, single-board computers, with Grafana Cloud's out-of-the-box monitoring solution.
Learn more

