
ORACLE数据库监控
配合zabbix监控模板,对oracle数据库的关键指标进行监控,可在一个页面内切换查看多个实例。
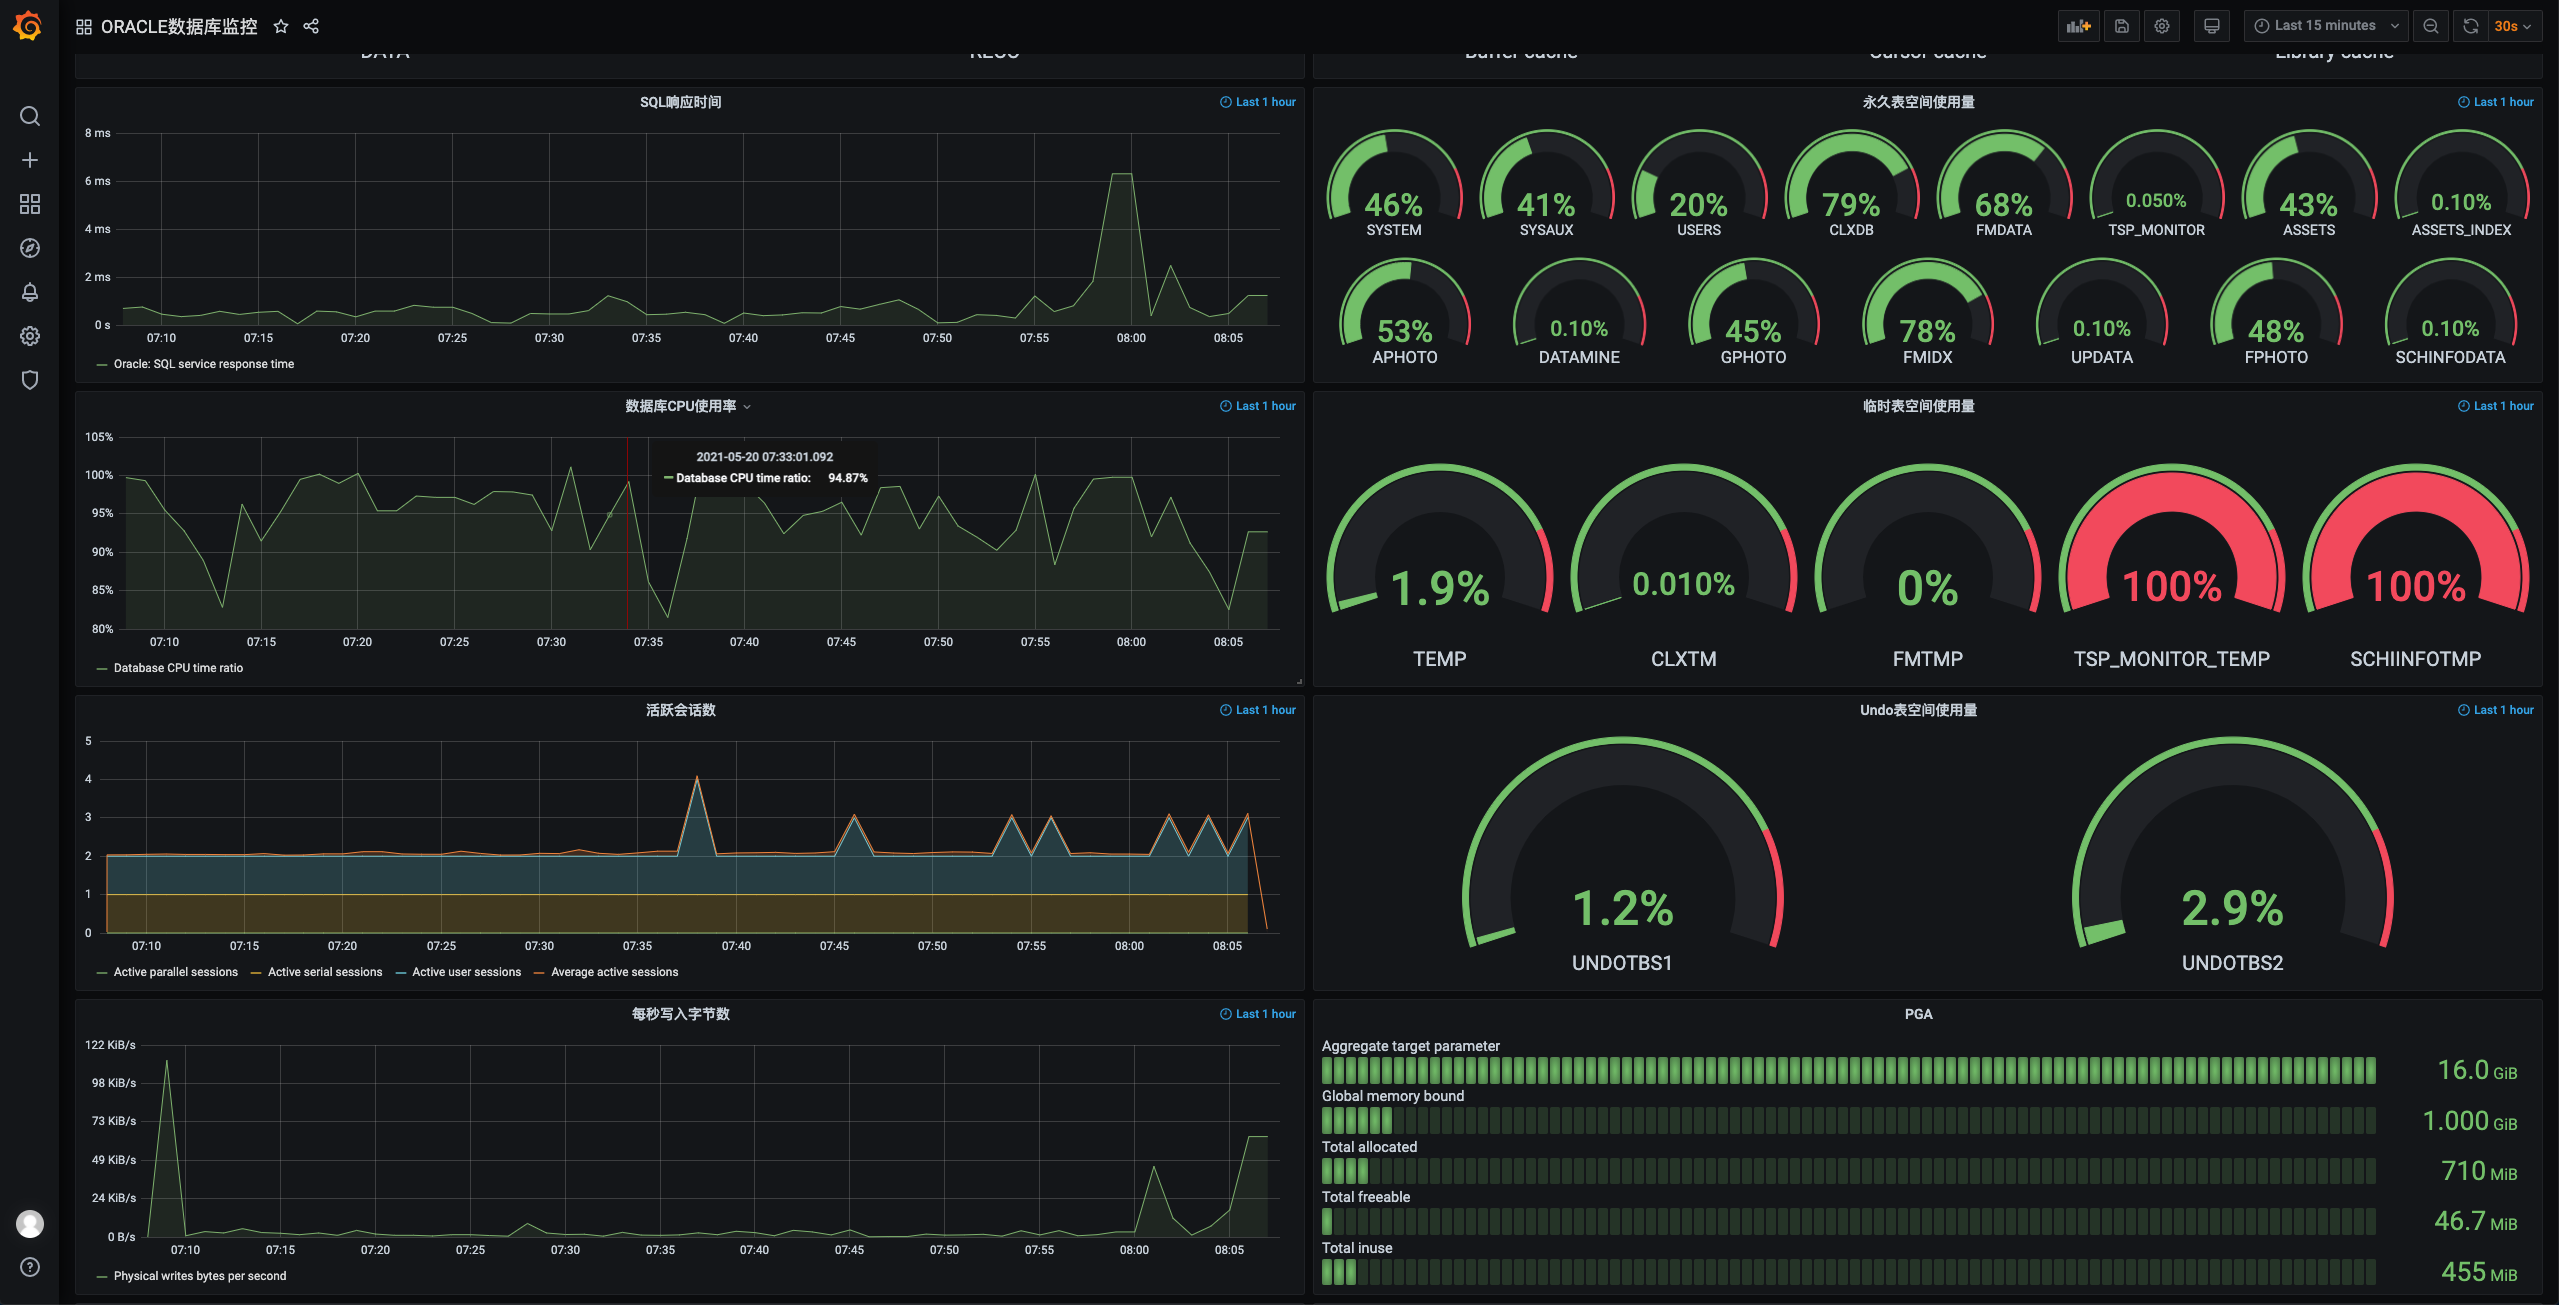
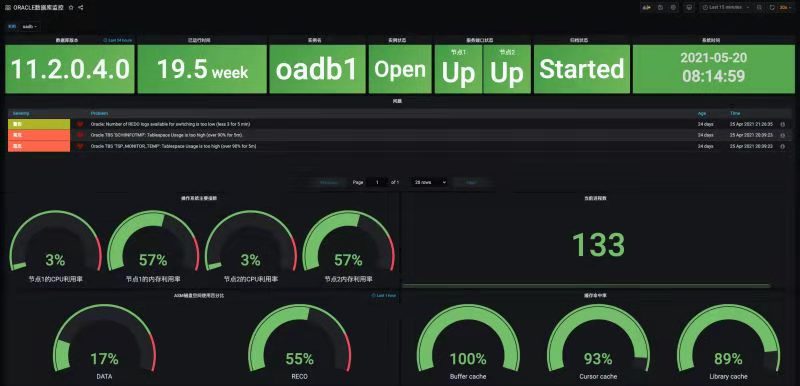
The ORACLE数据库监控 dashboard uses the alexanderzobnin-zabbix-datasource data source to create a Grafana dashboard with the alexanderzobnin-zabbix-triggers-panel, bargauge, gauge, grafana-clock-panel, graph and stat panels.
Data source config
Collector type:
Collector plugins:
Collector config:
Revisions
Upload an updated version of an exported dashboard.json file from Grafana
| Revision | Description | Created | |
|---|---|---|---|
| Download |