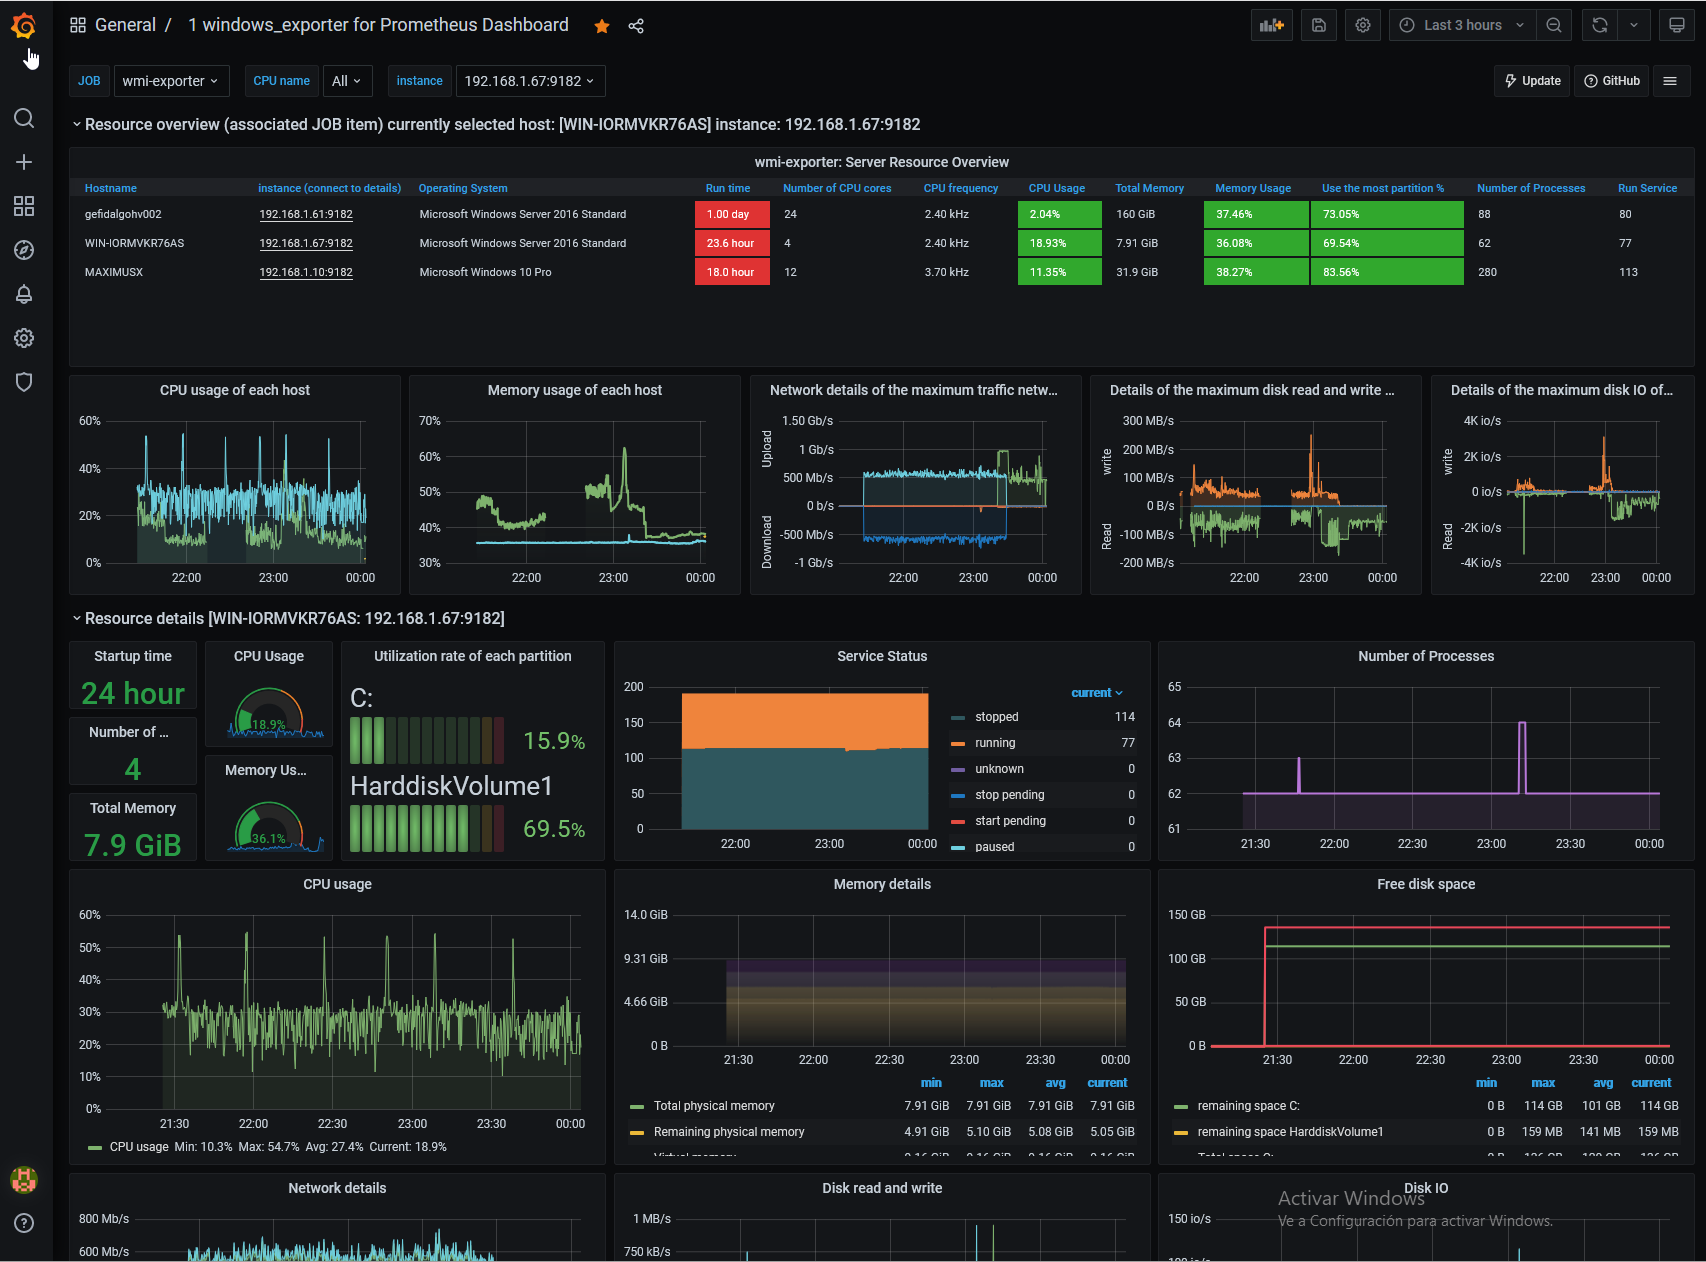
windows_exporter for Prometheus Dashboard EN
Windows Prometheus monitors the Kanban display, adds the resource summary display, and optimizes the detailed display. The update supports windows_exporter 0.13.0. THIS IS ONLY A TRANSLATION. CREDITS TO StarsL.cn source dashboard ID 10467
Prometheus Configuration nano /etc/prometheus/prometheus.yml
------ add targets for scrapping ------
- job_name: 'wmi-exporter'
static_configs:
- targets: ['XX.XX.XX.XX:9182','XX.XX.XX.XX:9182','XX.XX.XX.XX:9182']
Data source config
Collector config:
Upload an updated version of an exported dashboard.json file from Grafana
| Revision | Description | Created | |
|---|---|---|---|
| Download |
Metrics Endpoint (Prometheus)
Easily monitor any Prometheus-compatible and publicly accessible metrics URL with Grafana Cloud's out-of-the-box monitoring solution.
Learn more
