
Asyncworker HTTP Routes
Metrics visualization for async-worker automatically exposed HTTP metrics with detailed and customizable monitoring for request duration, throughput, response sizes, error rate, and much more.
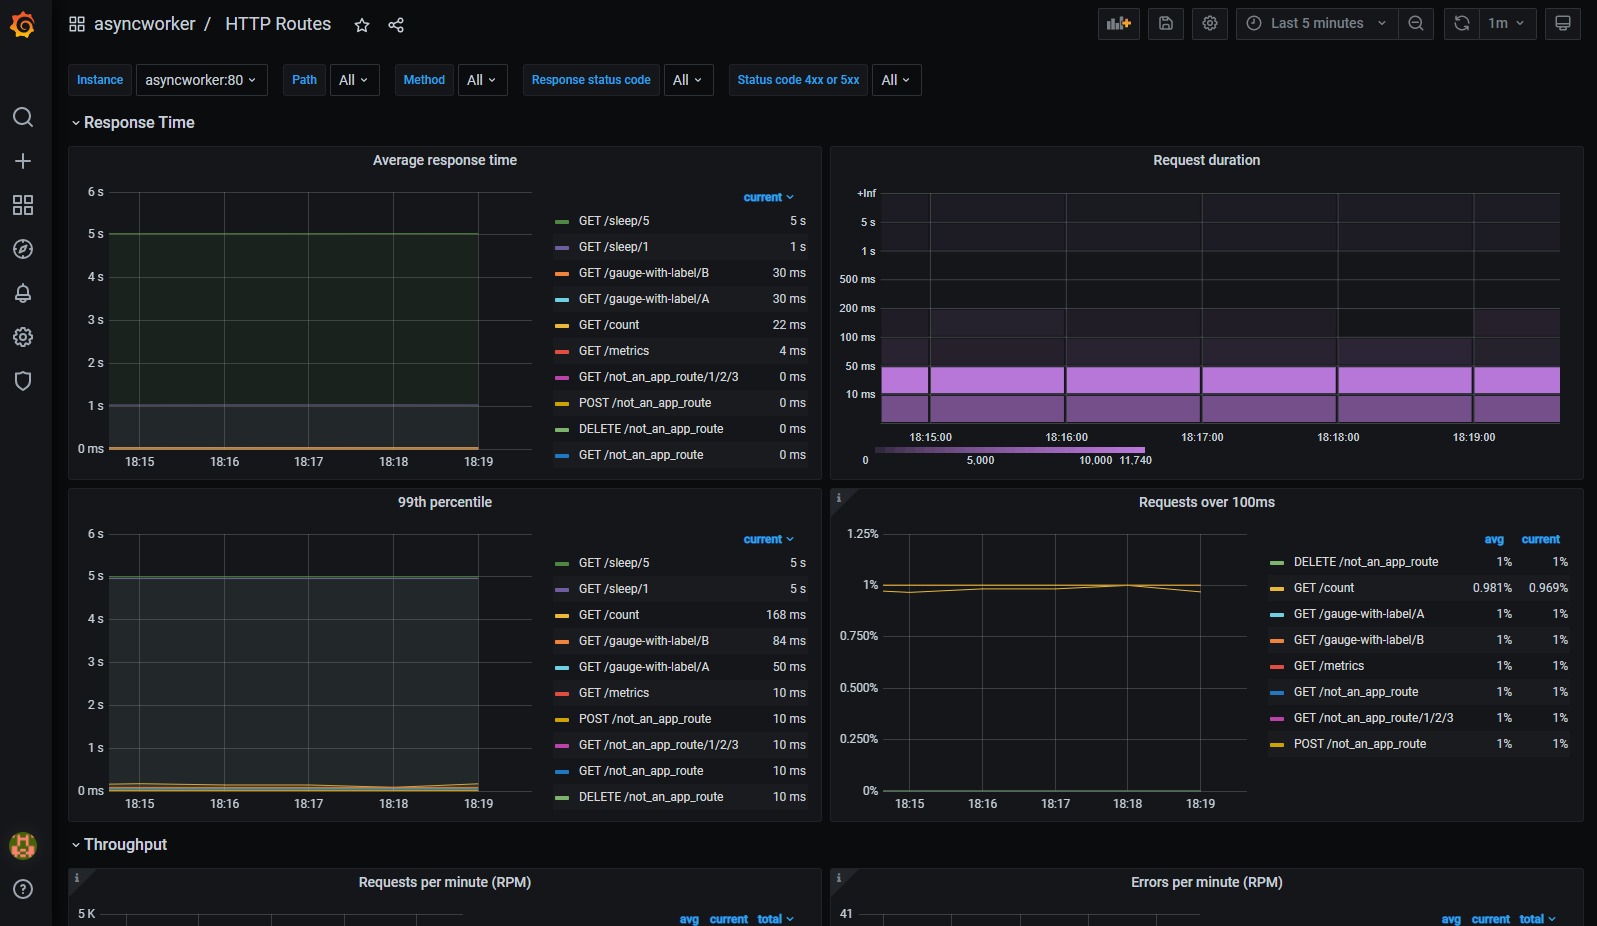
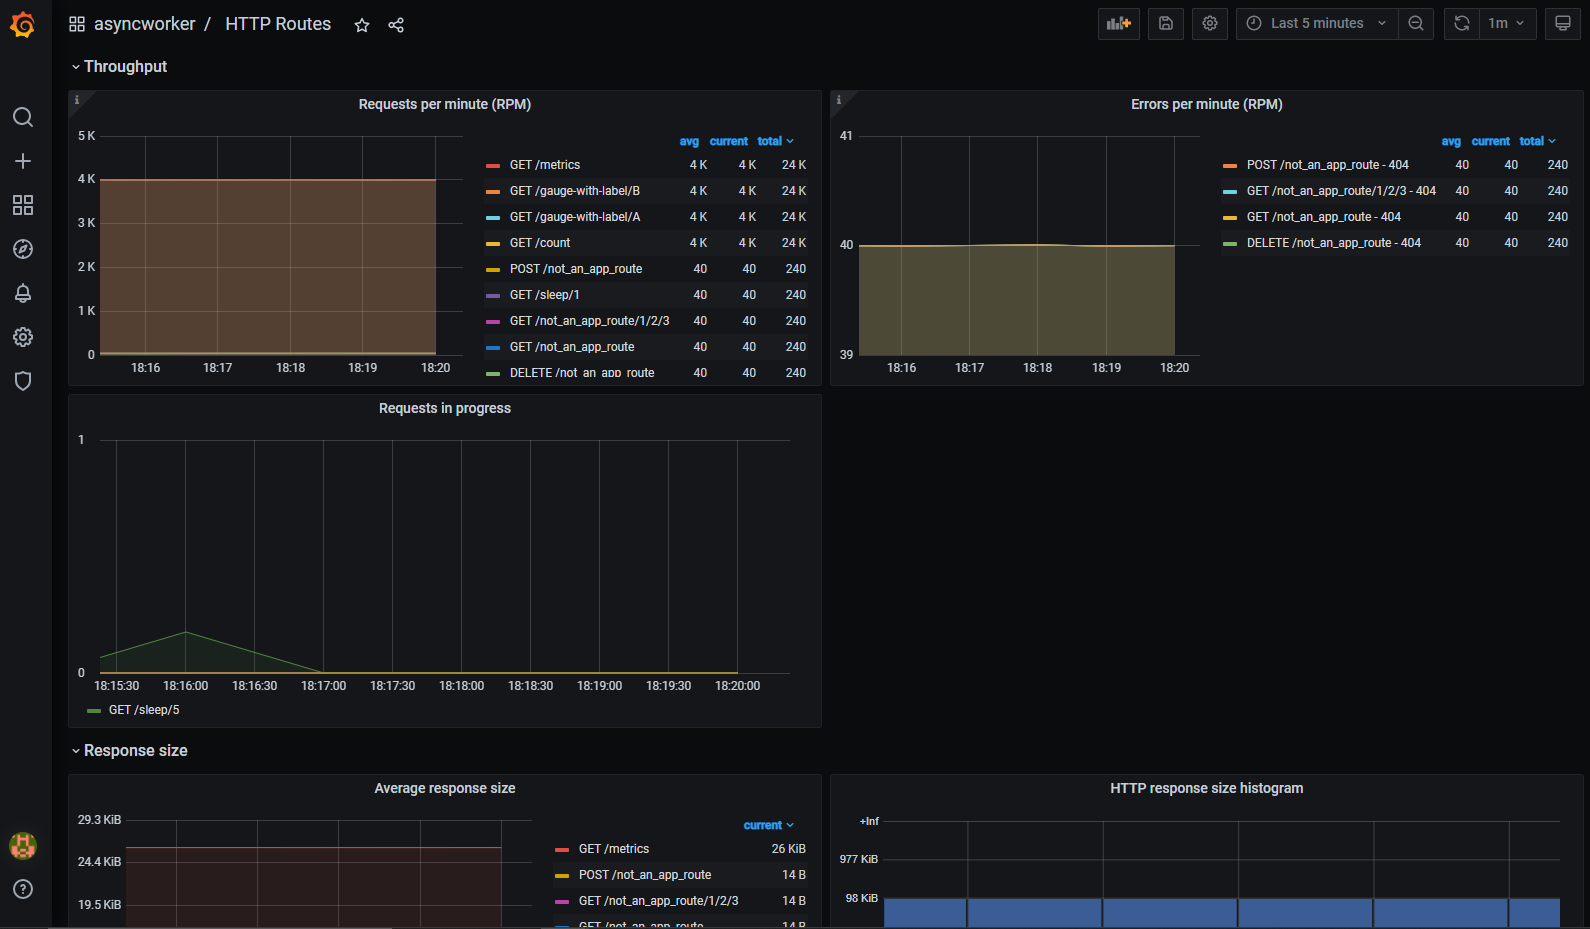
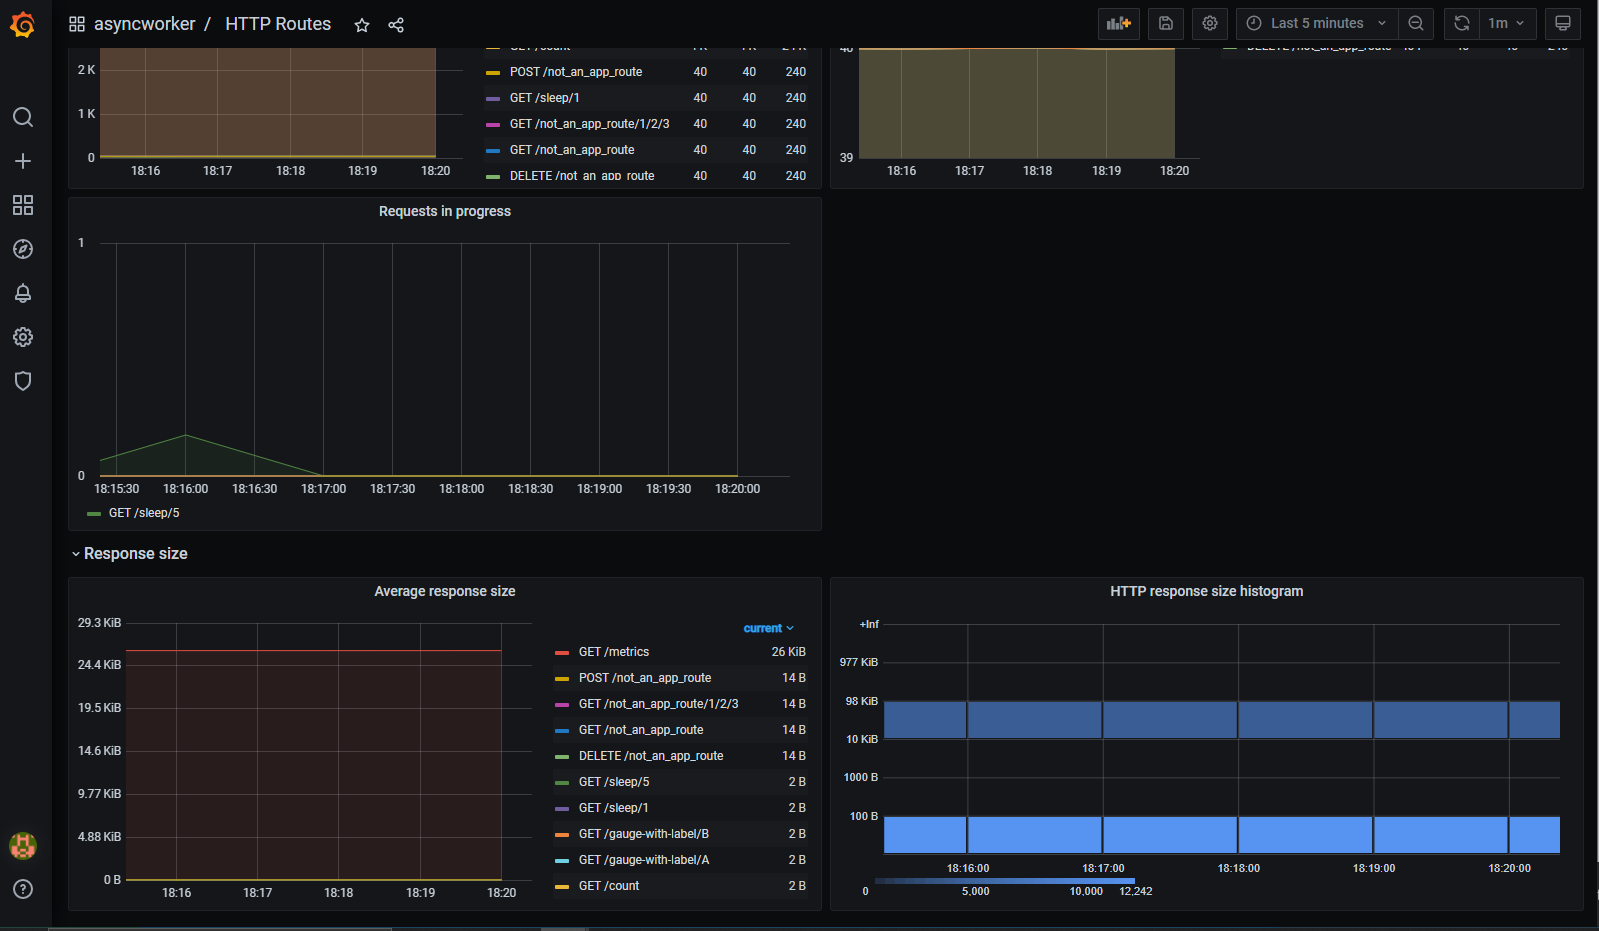
Metrics visualization for async-worker automatically exposed HTTP metrics with detailed and customizable monitoring for request duration, throughput, response sizes, error rate, and much more.
This dashboard is meant to be used by applications developed using python's async-worker framework
Data source config
Collector type:
Collector plugins:
Collector config:
Revisions
Upload an updated version of an exported dashboard.json file from Grafana
| Revision | Description | Created | |
|---|---|---|---|
| Download |
Apache HTTP Server
Easily monitor Apache HTTP Server, an open source HTTP server for modern operating systems including UNIX and Windows, with Grafana Cloud's out-of-the-box monitoring solution.
Learn more