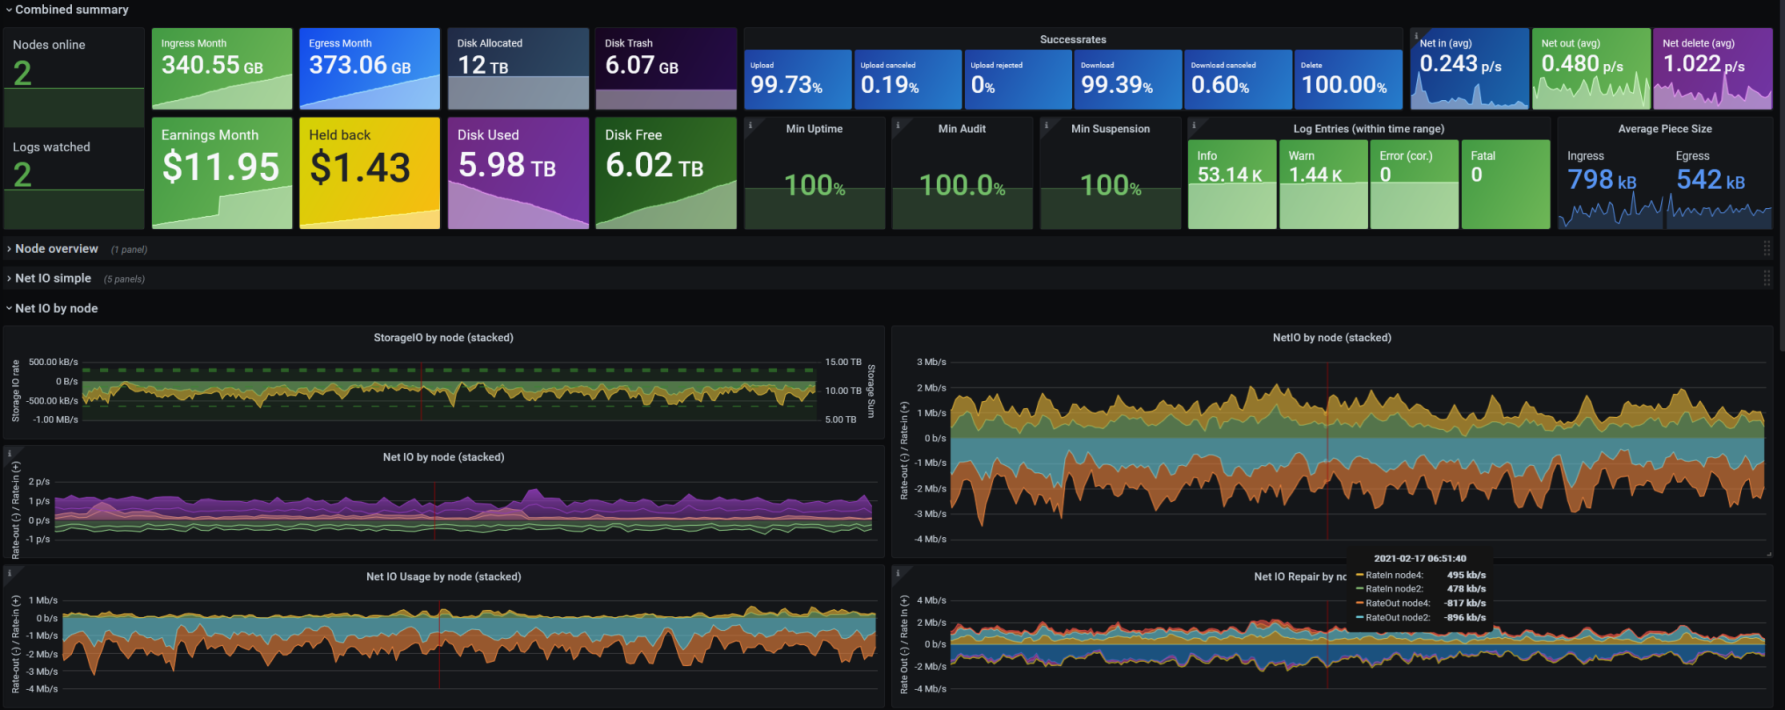
Storj-Exporter-Boom-Table-combined
Storj Exporter dashboard combined
Dashboard to visualise Storj-Exporter and Storj-Log-Exporter metrics for multiple Storj storage nodes. See the post on the storj forum for more information on how to set up the exporters/monitoring for multiple nodes: how-to-monitor-all-nodes-in-your-lan-using-prometheus-grafana
Also this guide to set up the Log-Exporter: log-exporter-for-prometheus-with-grafana-dashboard
Support
The log-exporter is published on Github. Feel free to raise issues if you find them and also raise a PR if you'd like to contribute. Find more details in the README: https://github.com/kevinkk525/storj-log-exporter
Data source config
Collector config:
Upload an updated version of an exported dashboard.json file from Grafana
| Revision | Description | Created | |
|---|---|---|---|
| Download |


