Node Metrics
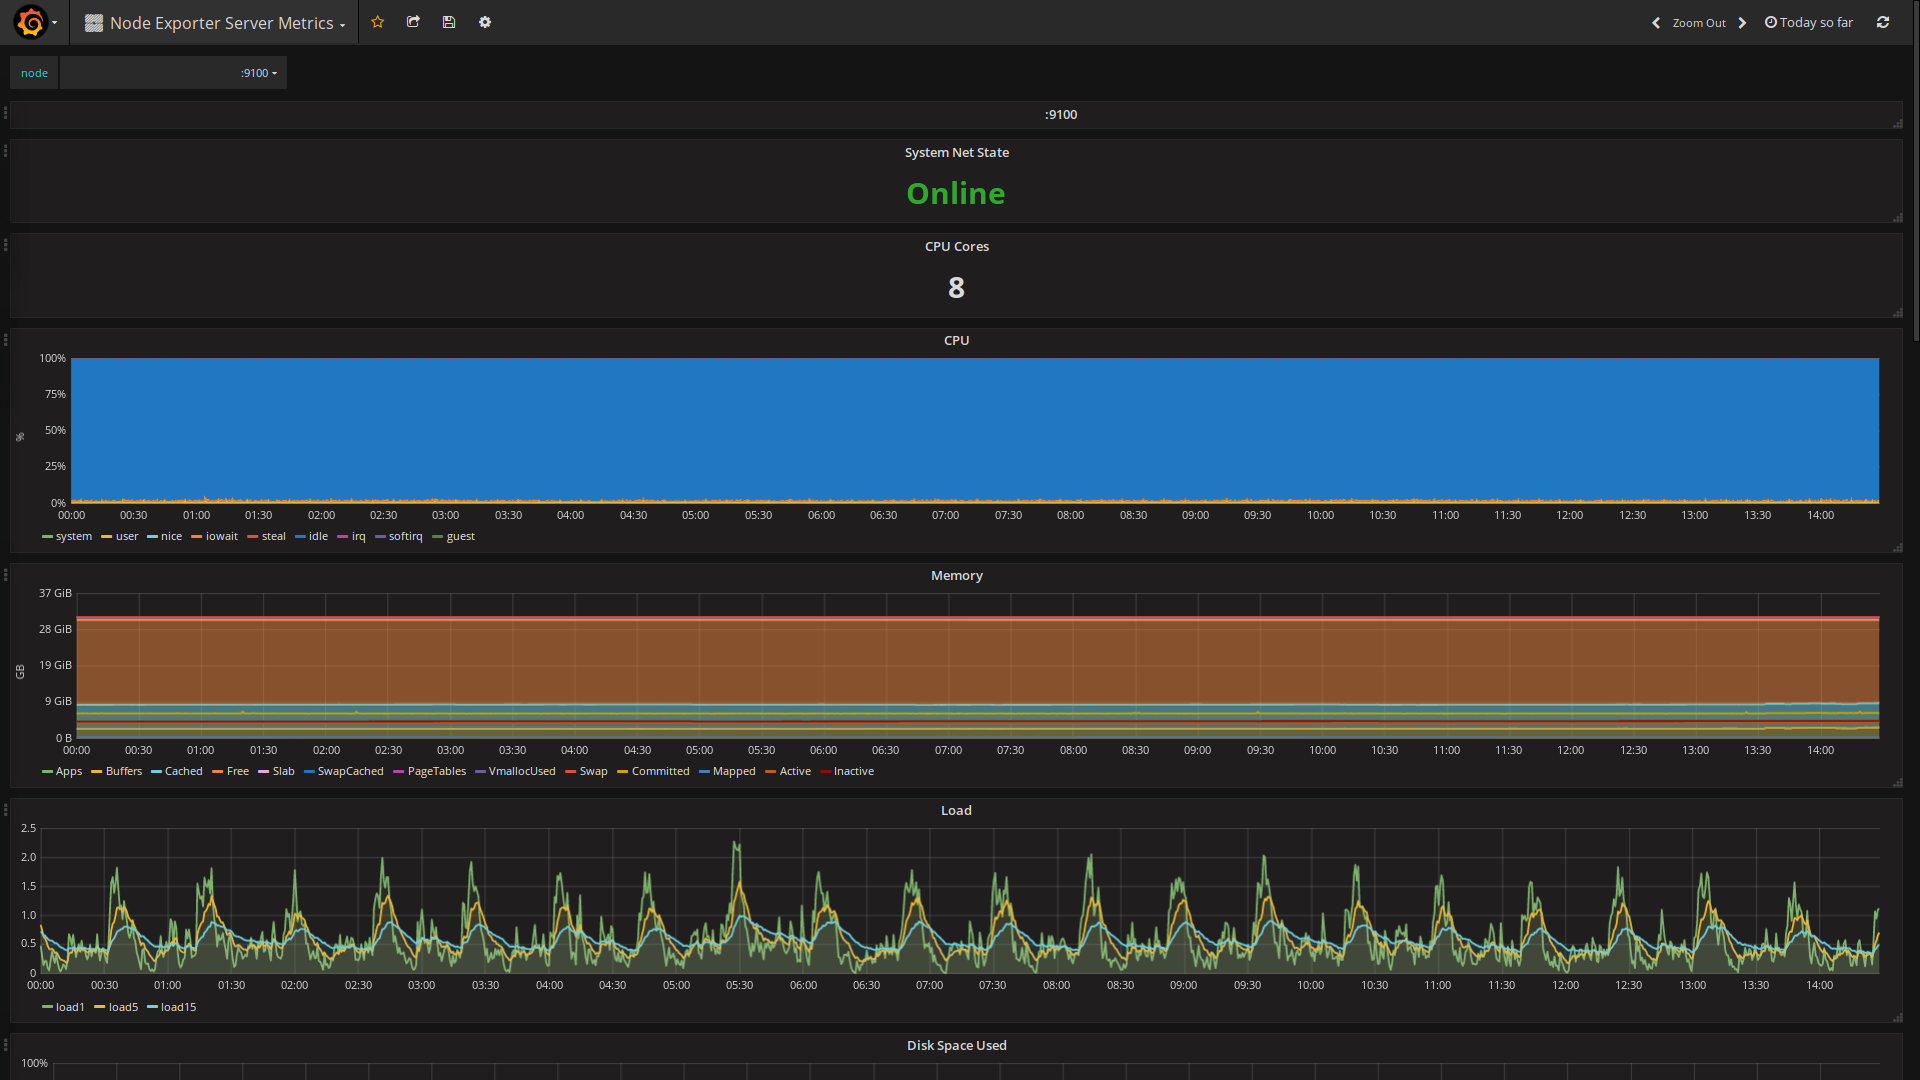
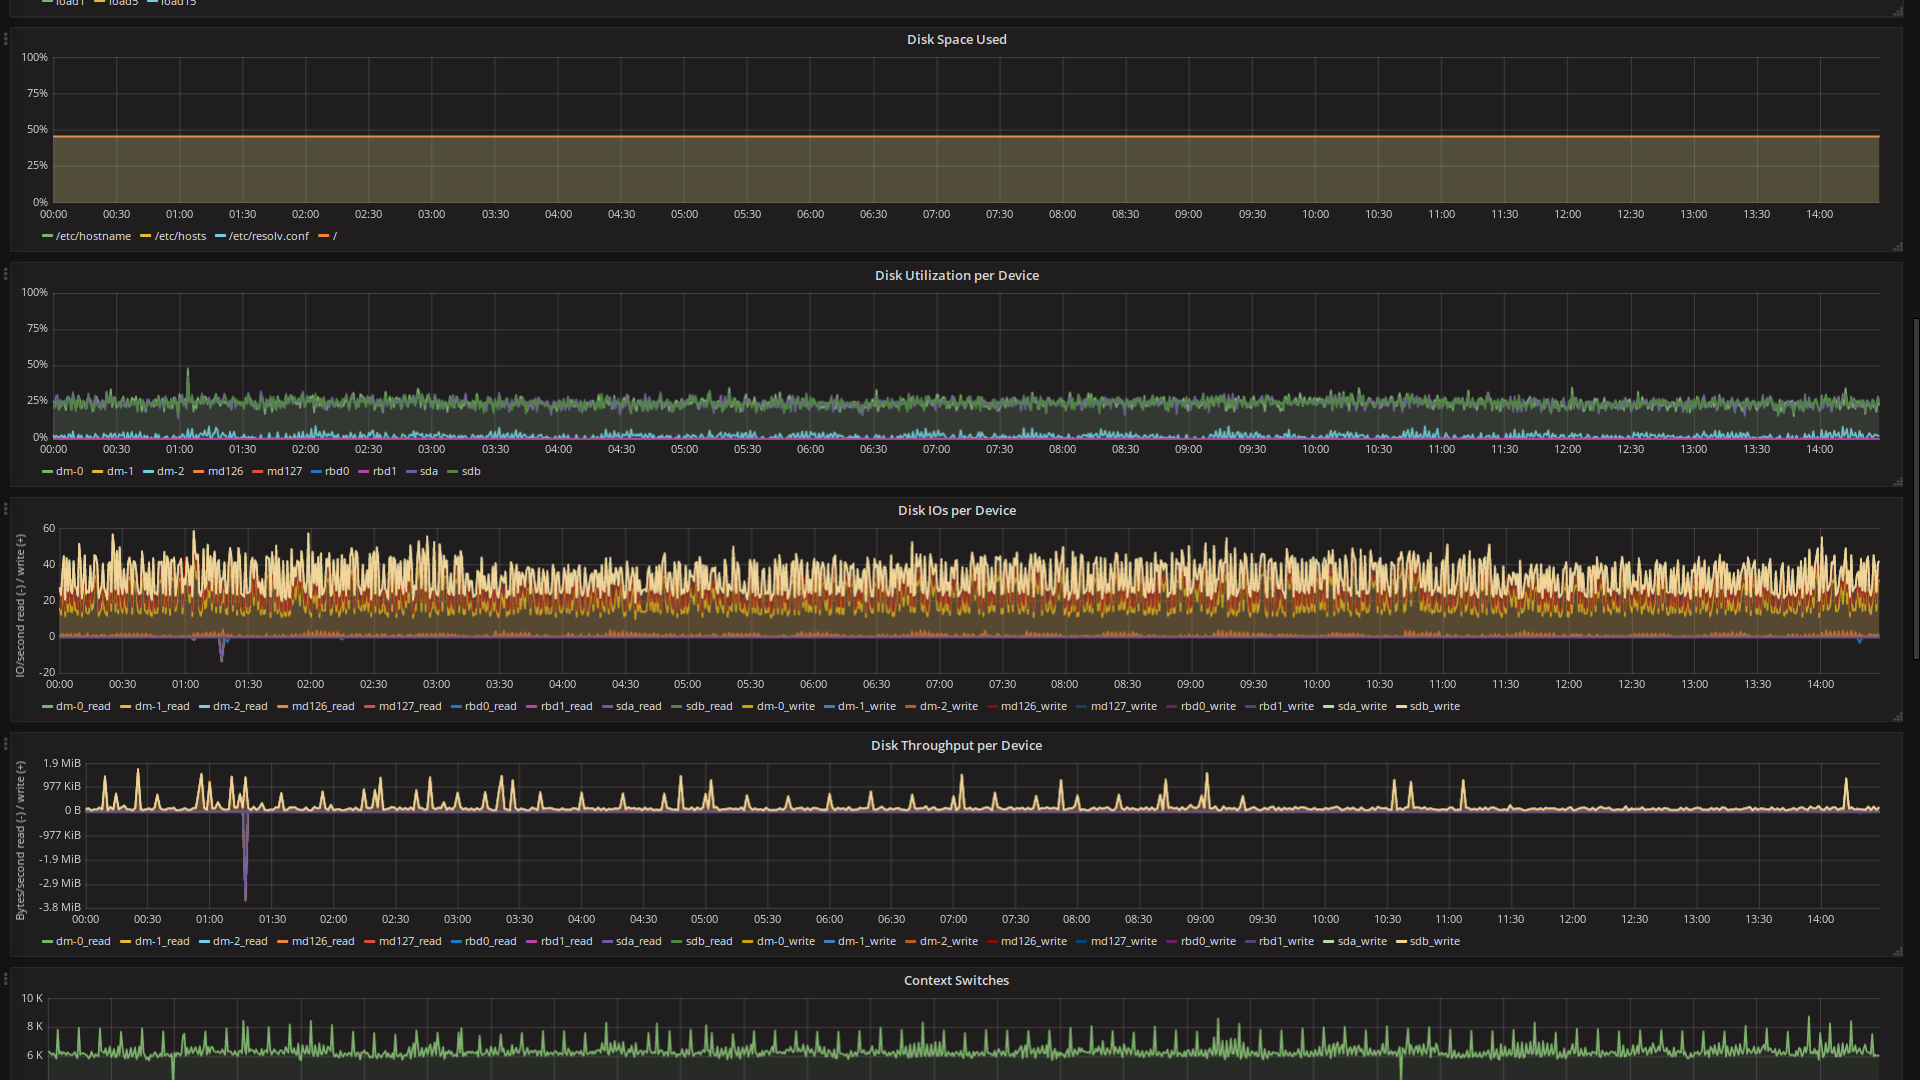
Dashboard to view multiple servers
Based on User knut Node Exporter Server Metrics dashboard.
Changelog
February 16th 2017
- Fix the repeat for HWMon and Online/UP state
January 28th 2017
- Added Online/Up state
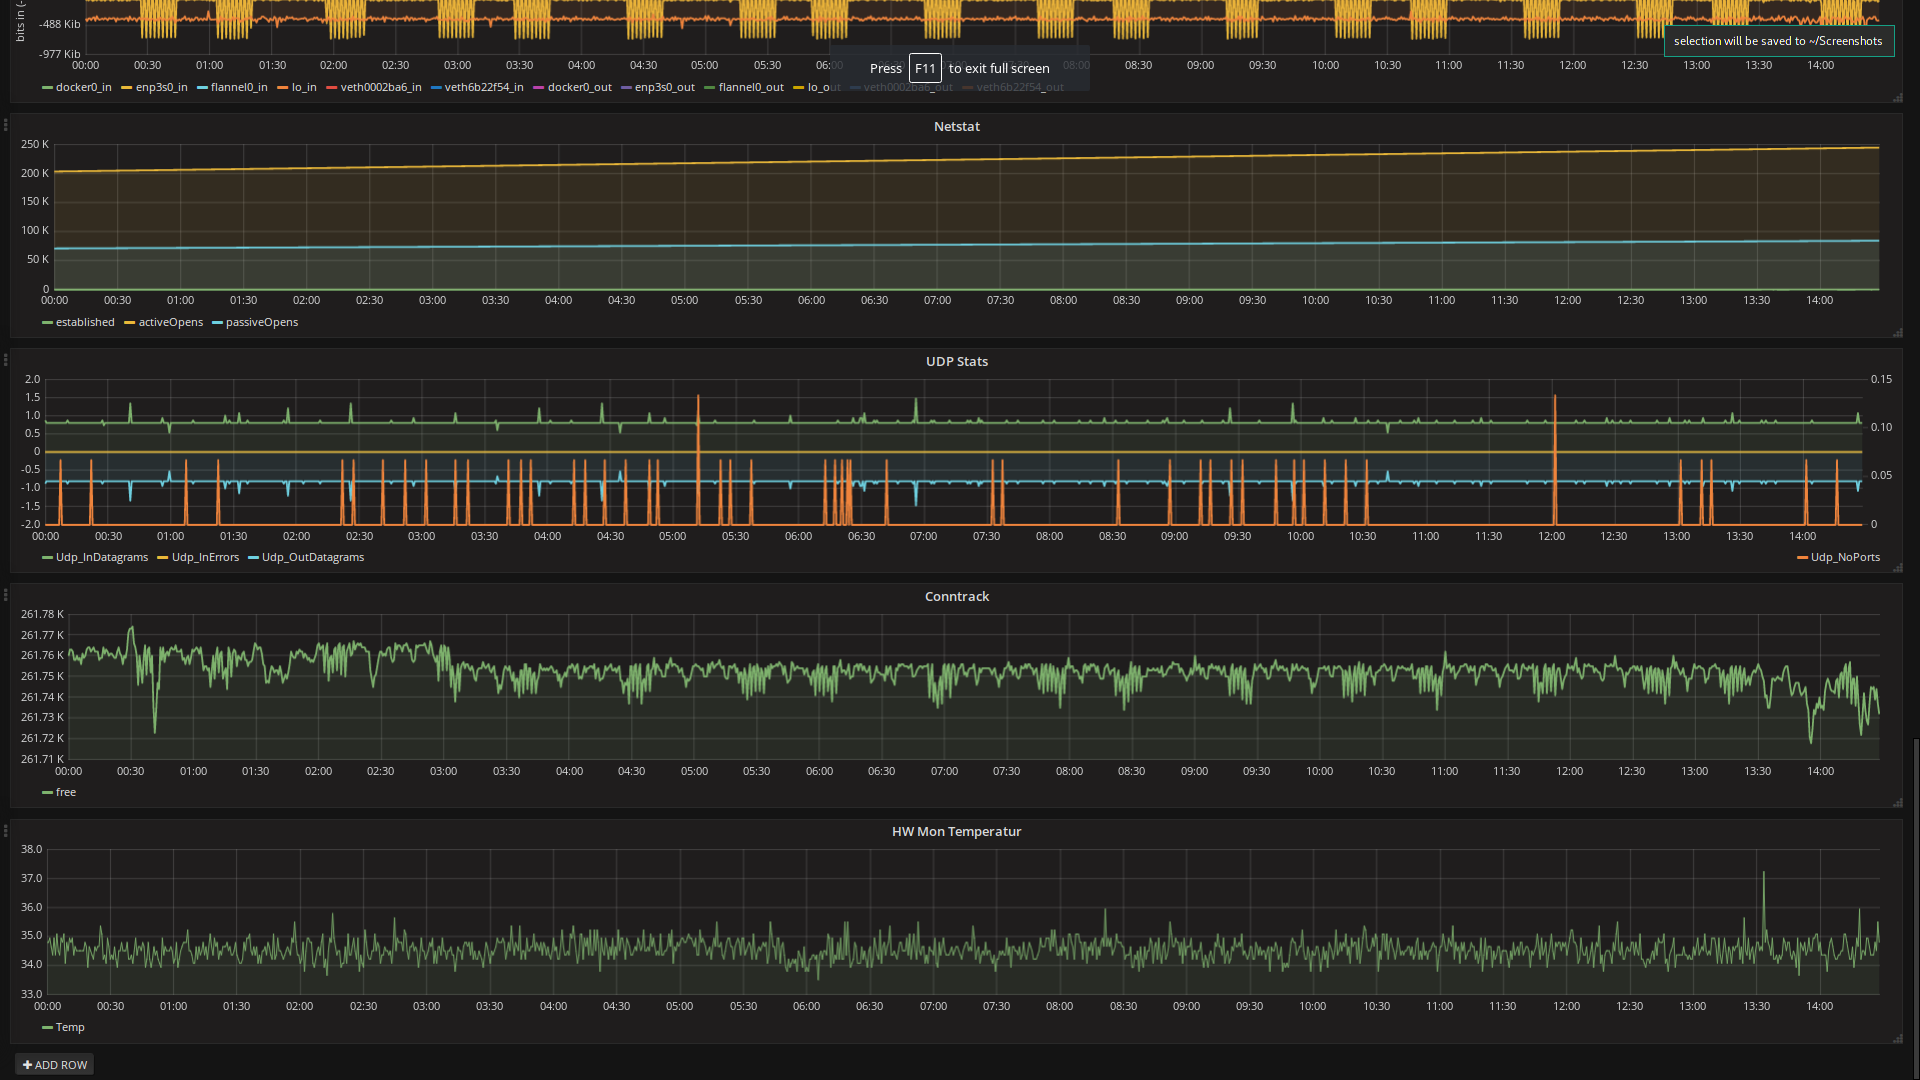
- Added HWMon Temperature
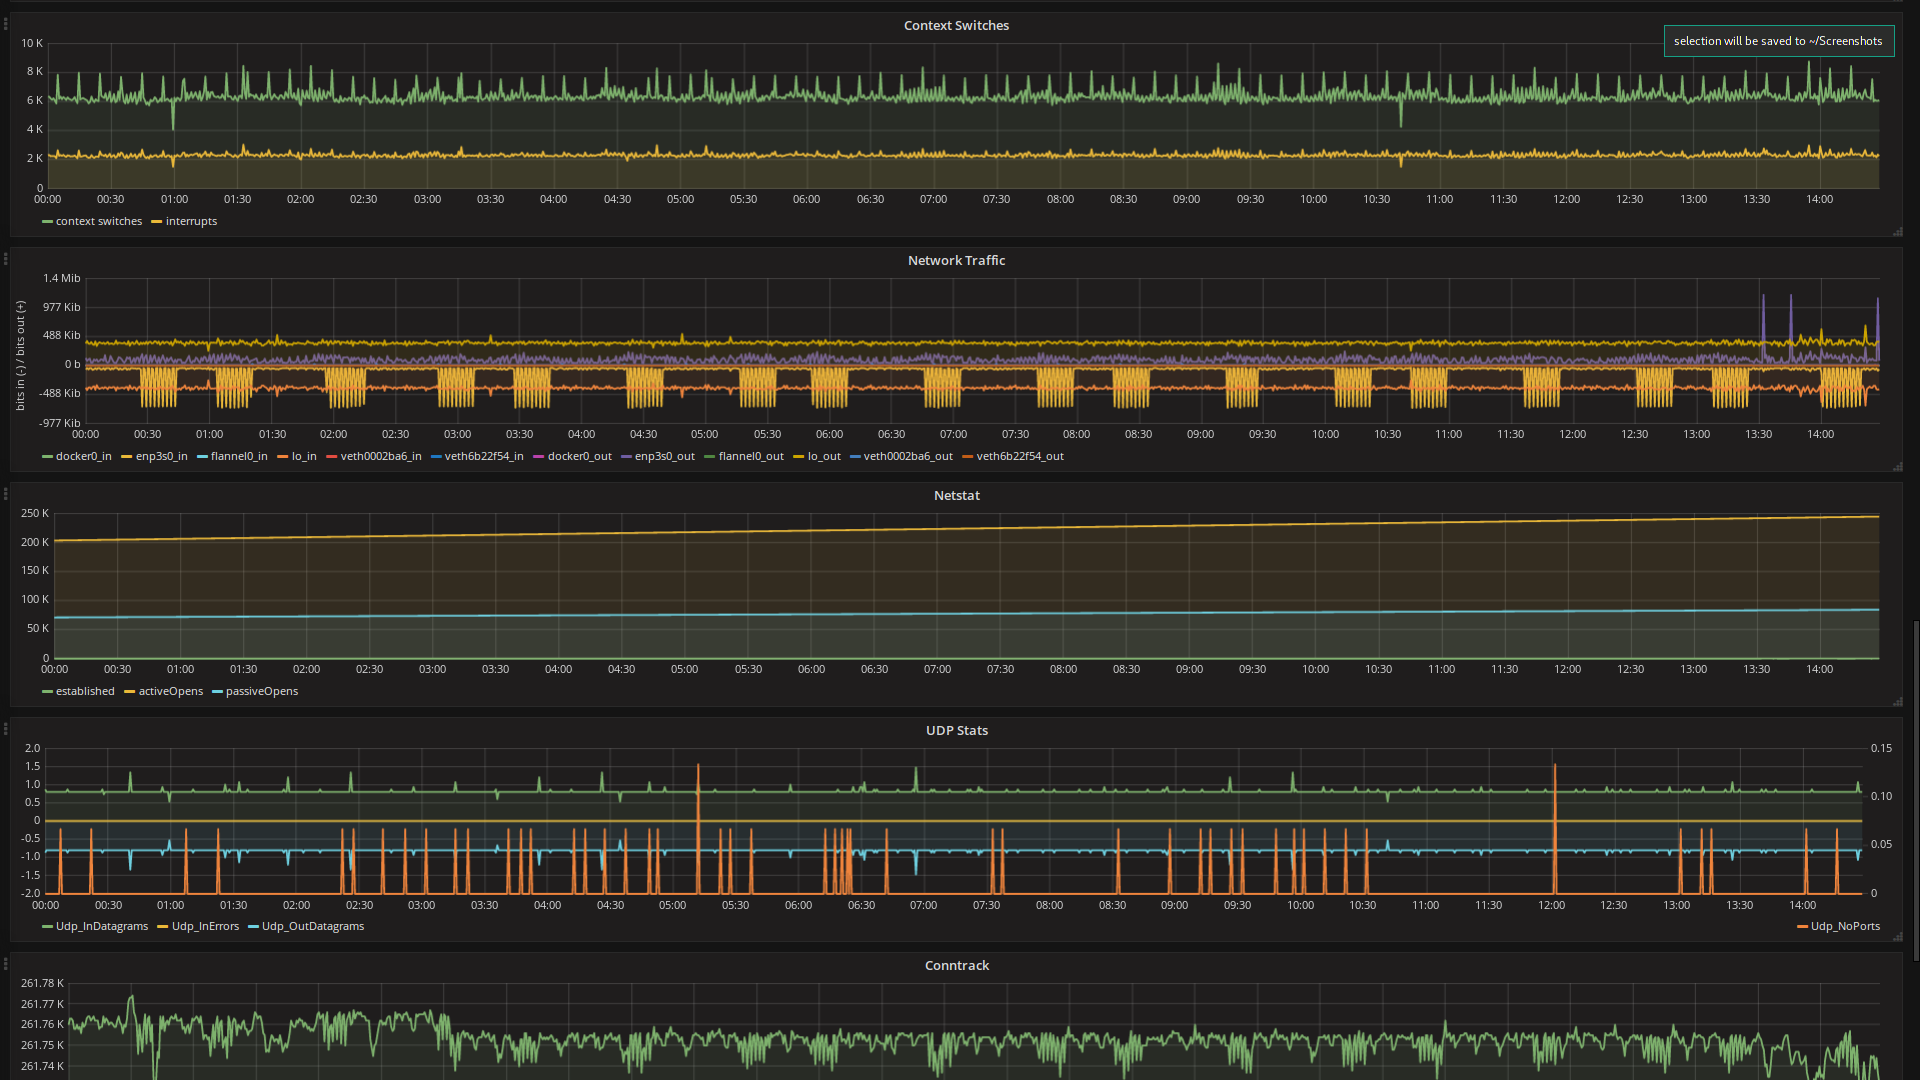
- Added interrupts to Context Switches Graph
- Added activeOpens and passiveOpens to the Netstat Graph
- Now the node selector updates on time range chanes
Data source config
Collector config:
Upload an updated version of an exported dashboard.json file from Grafana
| Revision | Description | Created | |
|---|---|---|---|
| Download |
Linux Server
Monitor Linux with Grafana. Easily monitor your Linux deployment with Grafana Cloud's out-of-the-box monitoring solution.
Learn more


