
1 Kubernetes All-in-one Cluster Monitoring KR
This dashboard is one of major topic for Kubernetes Book and best optimized for virtual machine environment provided with https://github.com/sysnet4admin/_Book_k8sInfra Notice: It may be running on the other environment but cannot be guaranteed.
쿠버네티스 올인원 모니터링 대시보드
제작자
관련 정보
- ?도서: 컨테이너 인프라 환경 구축을 위한 쿠버네티스/도커
- ℹ️소스: 깃허브
중요한 알림
이 대시보드는 ?컨테이너 인프라 환경 구축을 위한 쿠버네티스/도커 책에서 사용된 대시보드입니다. 따라서 ?컨테이너 인프라 환경 구축을 위한 쿠버네티스/도커 책에서 제공하는 가상머신 환경에 최적화 되어 있습니다. 책의 실습 환경인 쿠버네티스 1.18.4, 그라파나 7.0.3, 프로메테우스 2.19.0, 노드 익스포터 1.0.1에서 정상 동작을 확인하였으며, 클라우드 사에서 제공하는 EKS,AKS,GKE에서도 일부 익스포터를 깔고 설정하면 동작되는 것은 확인하였습니다. 여러가지의 고려 사항들이 있을 수 있기 때문에 이를 보증하진 않습니다.
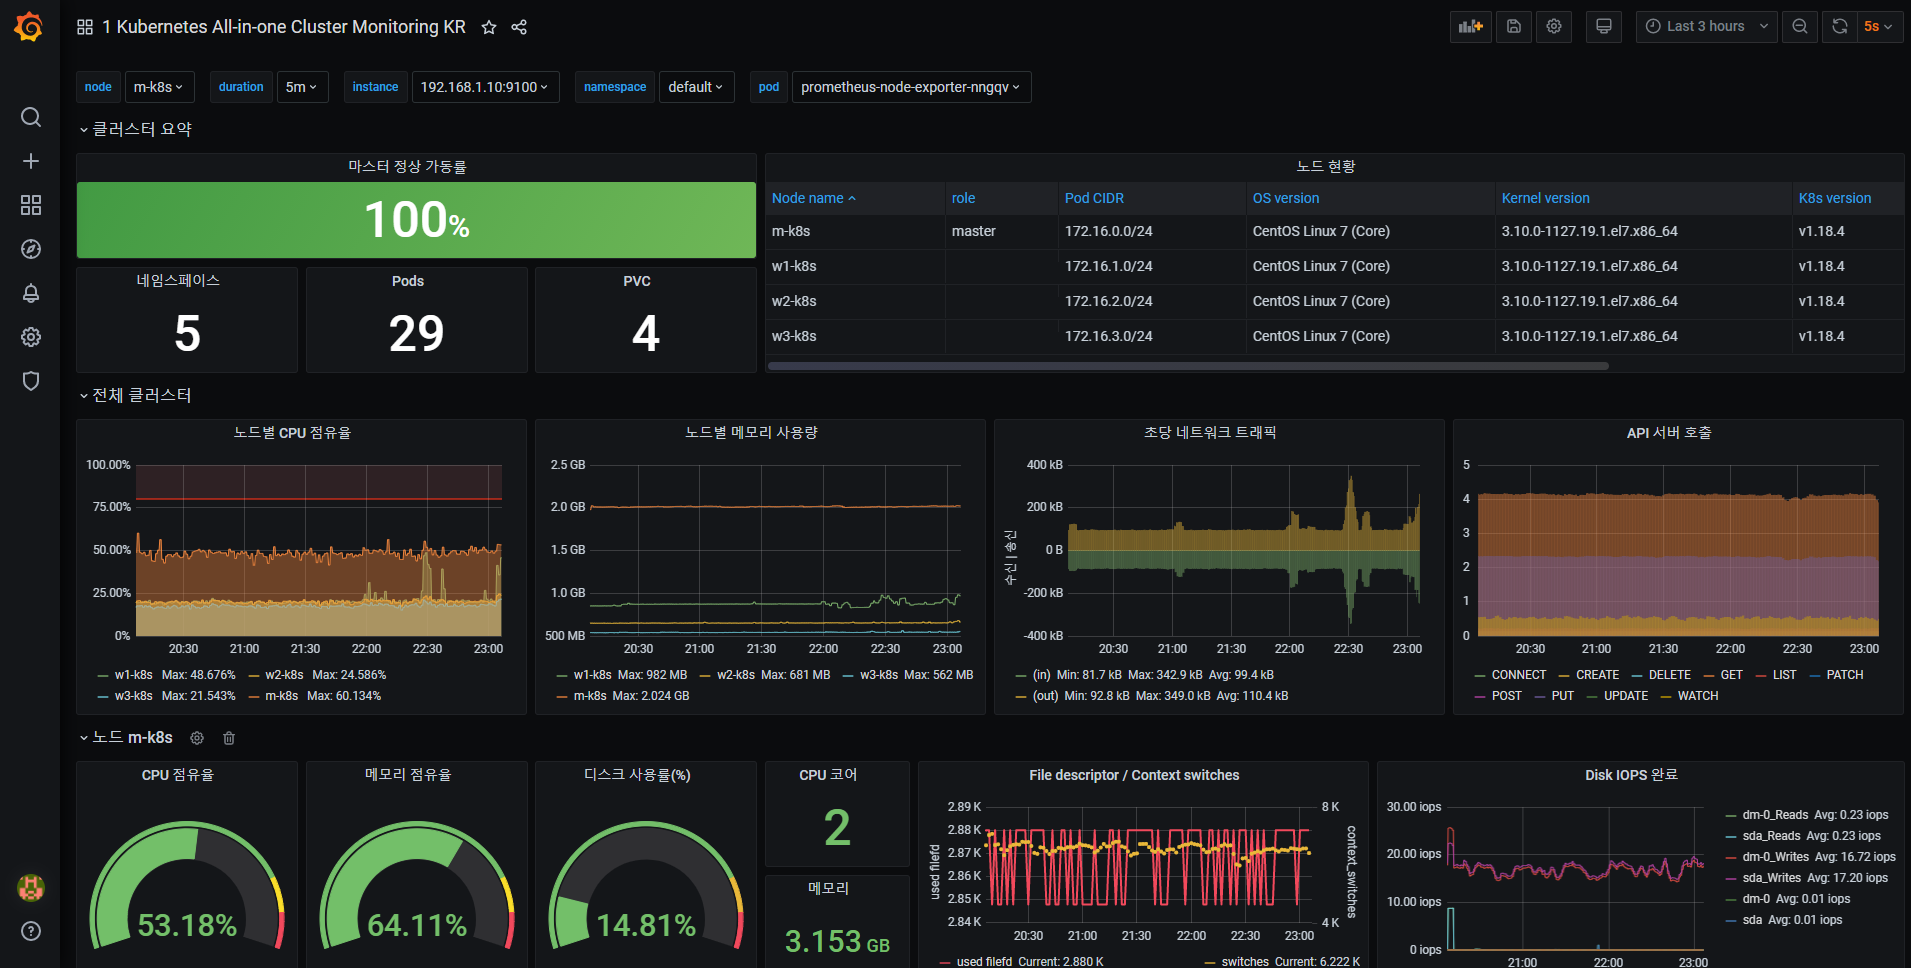
이 대시보드는 쿠버네티스 클러스터의 운영과 문제 해결에 필요한 정보를 보여줍니다. 4개의 영역으로 구성되어 있으며 각 영역에서는 아래와 같은 정보를 확인할 수 있습니다.
- 클러스터 요약
- 마스터 정상 가동률
- 네임스페이스, Pod, PVC의 숫자
- 노드별 현황 정보를 보여주는 테이블
- 클러스터 전체 정보
- 노드별 CPU 점유율
- 노드별 메모리 사용량
- 클러스터 수준의 초당 평균 네트워크 트래픽
- API 서버 호출 통계
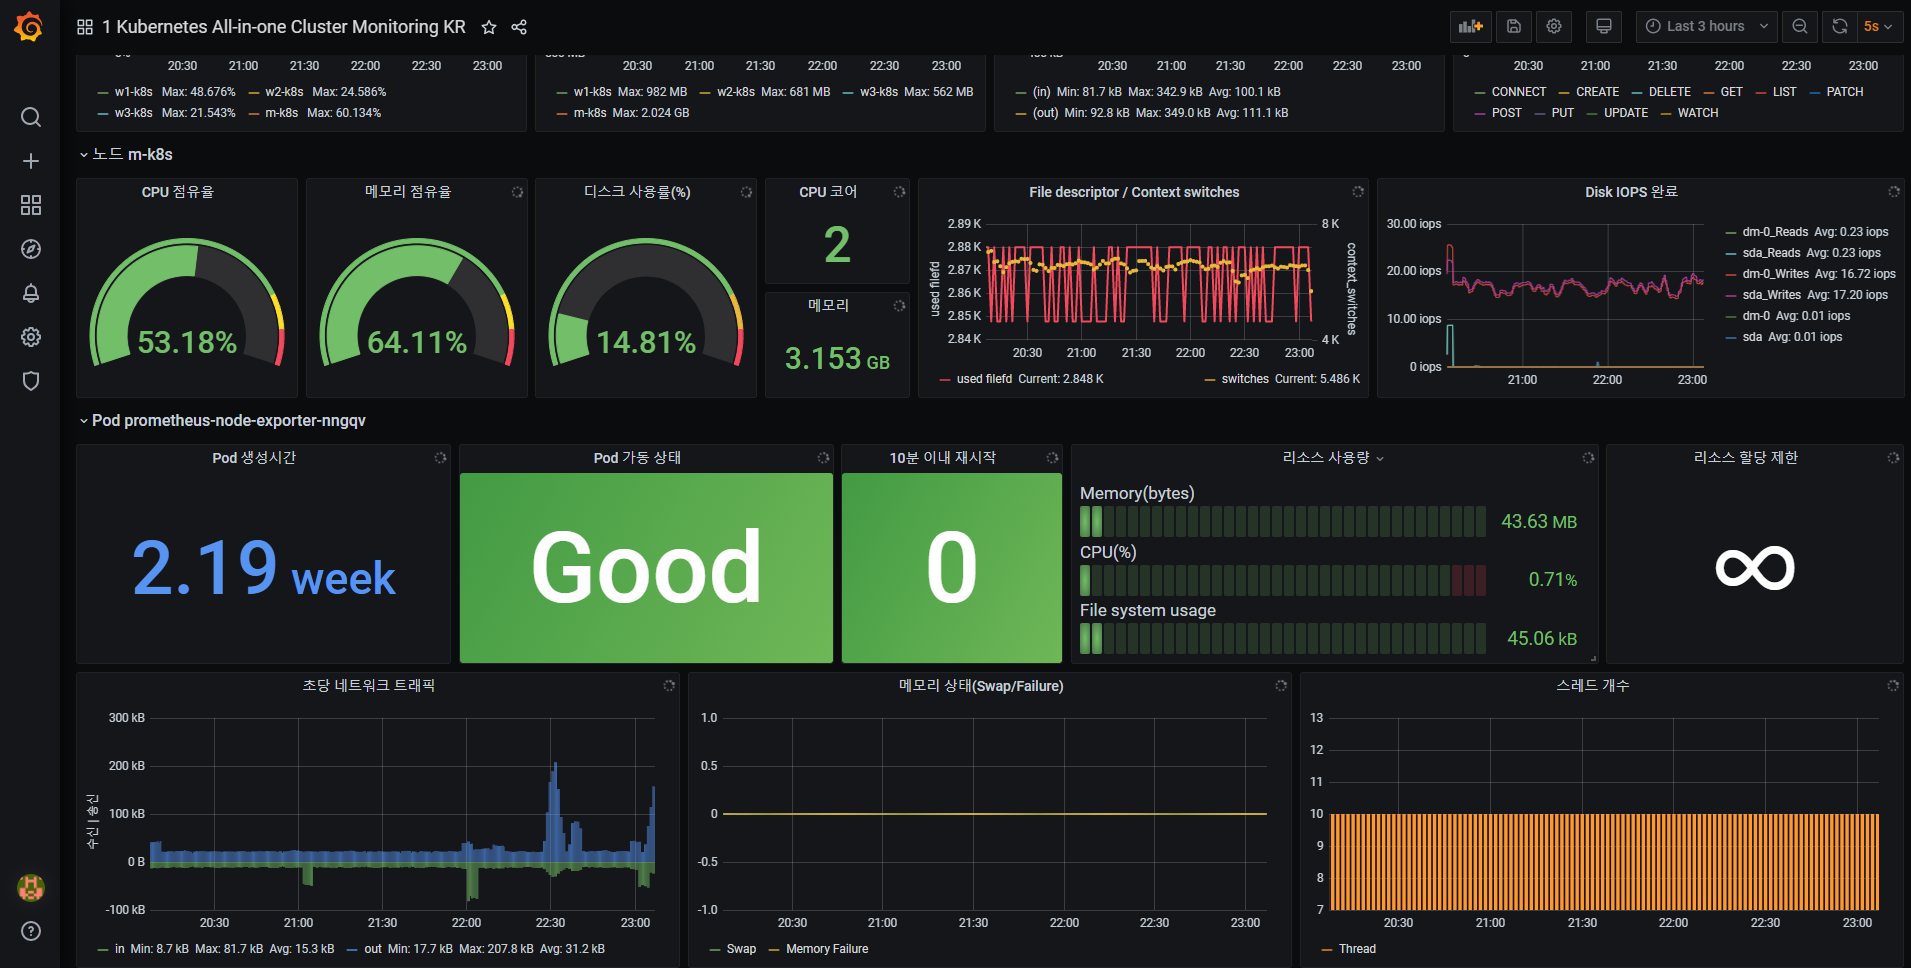
- 노드별 정보
- CPU 점유율
- 메모리 점유율
- 디스크 사용률
- CPU 코어 개수
- 전체 메모리 용량
- 파일 디스크립터와 컨텍스트 스위칭
- 완료된 디스크 IOPS
- Pod별 정보
- 가동 시간
- 가동 상태
- 10분 이내 재시작 시도 횟수
- 리소스 사용량(메모리, CPU, FS)
- 리소스 할당 제한
- 초당 네트워크 트래픽
- 메모리 상태(Swap/Failure)
- 스레드 개수 [Release Note] 2021/01/24
- 최초 릴리즈
Kubernetes All-in-one Monitoring Dashboard
Important notes
This dashboard is one of major topic for Kubernetes Book and best optimized for virtual machine environment provided with Kubernetes/Docker for container infrastructure Tested Env like below
- Kubernetes 1.18.4
- Grafana 7.0.3
- Prometheus 2.19.0
- Node-exporter 1.0.1
It may be running on the other environment but cannot be guaranteed. This dashboard shows information of Kubernetes cluster which is involved in necessary to operate and troubleshoot problems It contains information of 4 sections. In each section, you can find information as below.
- cluster summary In this section, you will get
- Control plane availability
- Number of Namespaces, Pods, PVC
- Cluster information table
- cluster overall information
- CPU usage of each node
- Memory consumption of each node
- Network traffic per second of whole cluster
- stats of API server requests
- node specific information
- CPU usage
- Memory usage
- Disk usage
- File descriptor and context switches
- Completed Disk IOPS
- pod specific information
- Uptime
- Health status
- Restart attempts within 10 minutes
- Resource usage(Memory , CPU, File system)
- Resource quota
- Network traffic per second
- Memory status (swap / failure)
- Thread count [Release Note] 2021/01/24
- Initial release
Data source config
Collector config:
Upload an updated version of an exported dashboard.json file from Grafana
| Revision | Description | Created | |
|---|---|---|---|
| Download |
Kubernetes
Monitor your Kubernetes deployment with prebuilt visualizations that allow you to drill down from a high-level cluster overview to pod-specific details in minutes.
Learn more