Netdata: Network Stats
Detailed network stats (IPv4 and IPv6)
About dashboard
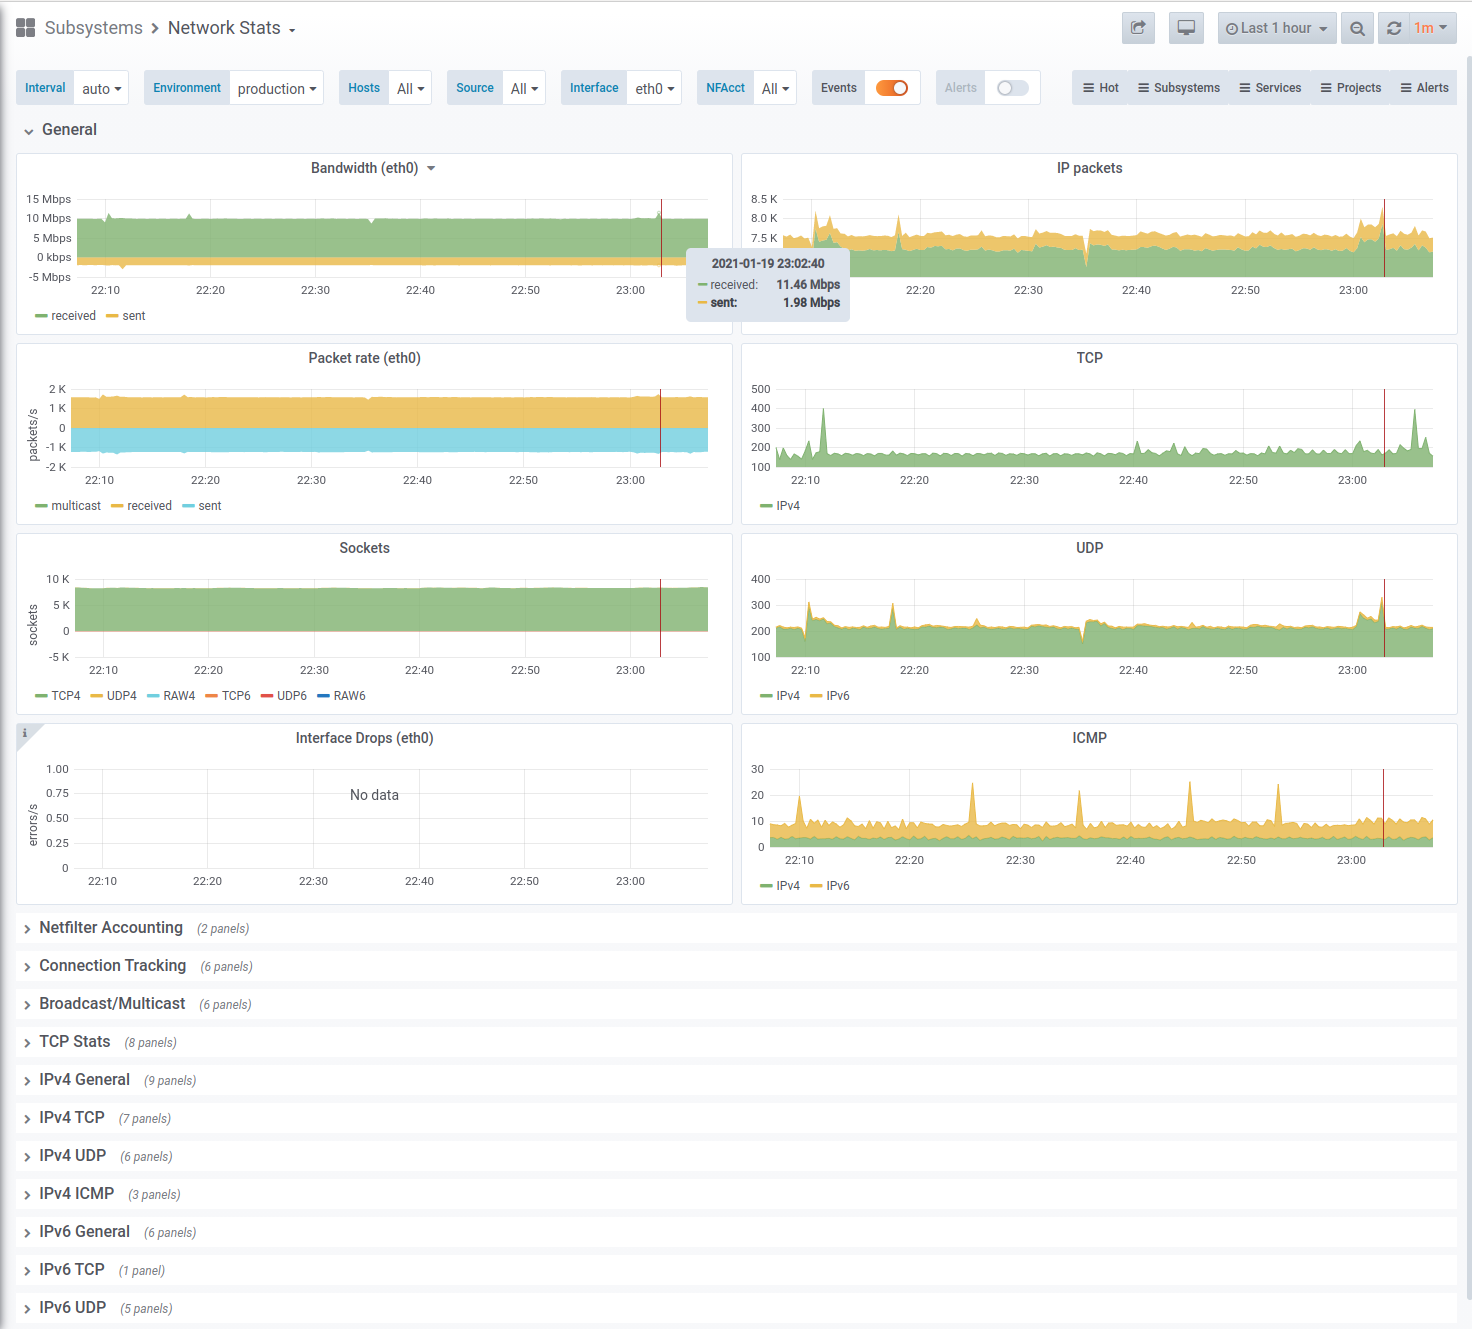
Dashboard with a detailed network statistics:
- bandwidth and pps per interfaces
- generic per-protocol stats
- netfilter accounting (bandwidth and pps)
- conntrack (connections, errors, changes, searches)
- broadcast and multicast (bandwidth and pps)
Generic stats for IPv4 and IPv6:
- sockets and packets
- errors and raw sockets
- fragments and reassembly
- aborts, syn cookies, ecn, out-of-order
Detailed stats for TCP/UDP/ICMP over IPv4 and IPv6:
- connections, sockets, packets
- handshakes, errors, memory usage
More dashboards for Netdata you can find here.
How to use
Netdata setup
Follow these instructions to setup network monitoring in Netdata.
Prometheus setup
Please note that you need Netdata as an exporter for metrics. Plus, these labels are mandatory:
- job
- env
- instance
- group
- source
In your prometheus.yml it should look like this:
- job_name: netdata
  metrics_path: /api/v1/allmetrics?format=prometheus_all_hosts&source=raw
  relabel_configs:
  - source_labels: [__address__]
    regex: ^(.+)\.\w+:\d+
    target_label: instance
    action: replace
  static_configs:
  - targets: [netdata.hostname.here:19999]
    labels:
      env: production
      group: applications
      source: newproject
WARNING: Without these labels, this dashboard won't be fully functioning.
Links
License
GPL3
Author
OSSHelp Team, see https://oss.help
Data source config
Collector type:
Collector plugins:
Collector config:
Revisions
Upload an updated version of an exported dashboard.json file from Grafana
| Revision | Description | Created | |
|---|---|---|---|
| Download |