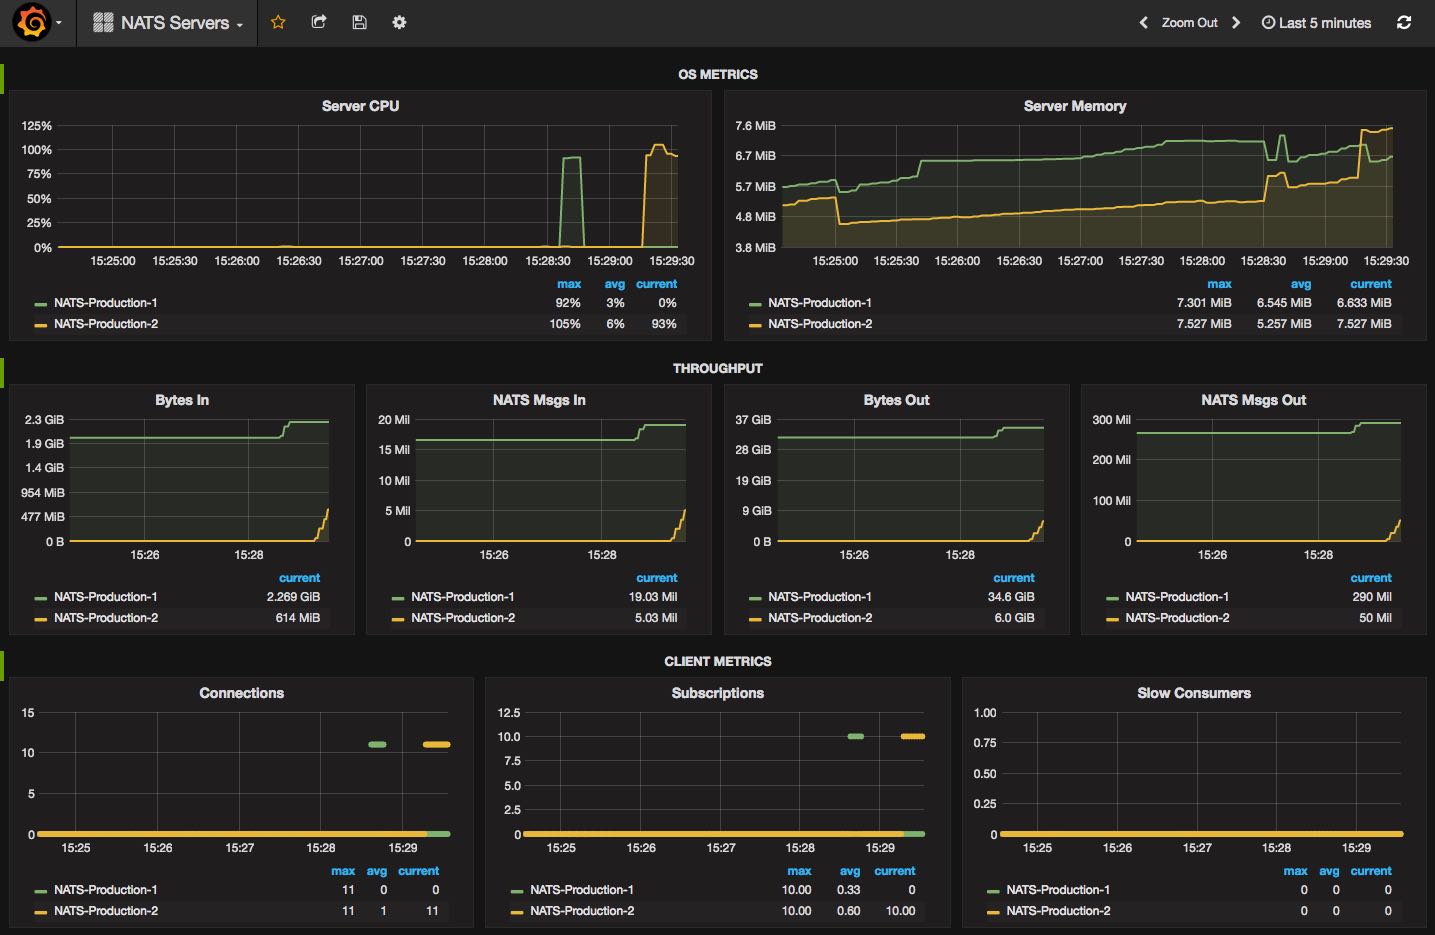
NATS Server Dashboard
NATS Server Dashboard for use with built-in Prometheus NATS Exporter into nats official helm charts
There were some changes in the NATS metrics e.g. gnatsd_ prefix is changed to nats_ in the metrics
Data source config
Collector config:
Upload an updated version of an exported dashboard.json file from Grafana
| Revision | Description | Created | |
|---|---|---|---|
| Download |

