IWDashboard
IW Dashboard for presenting JMeter and Jenkins metrics of test executions
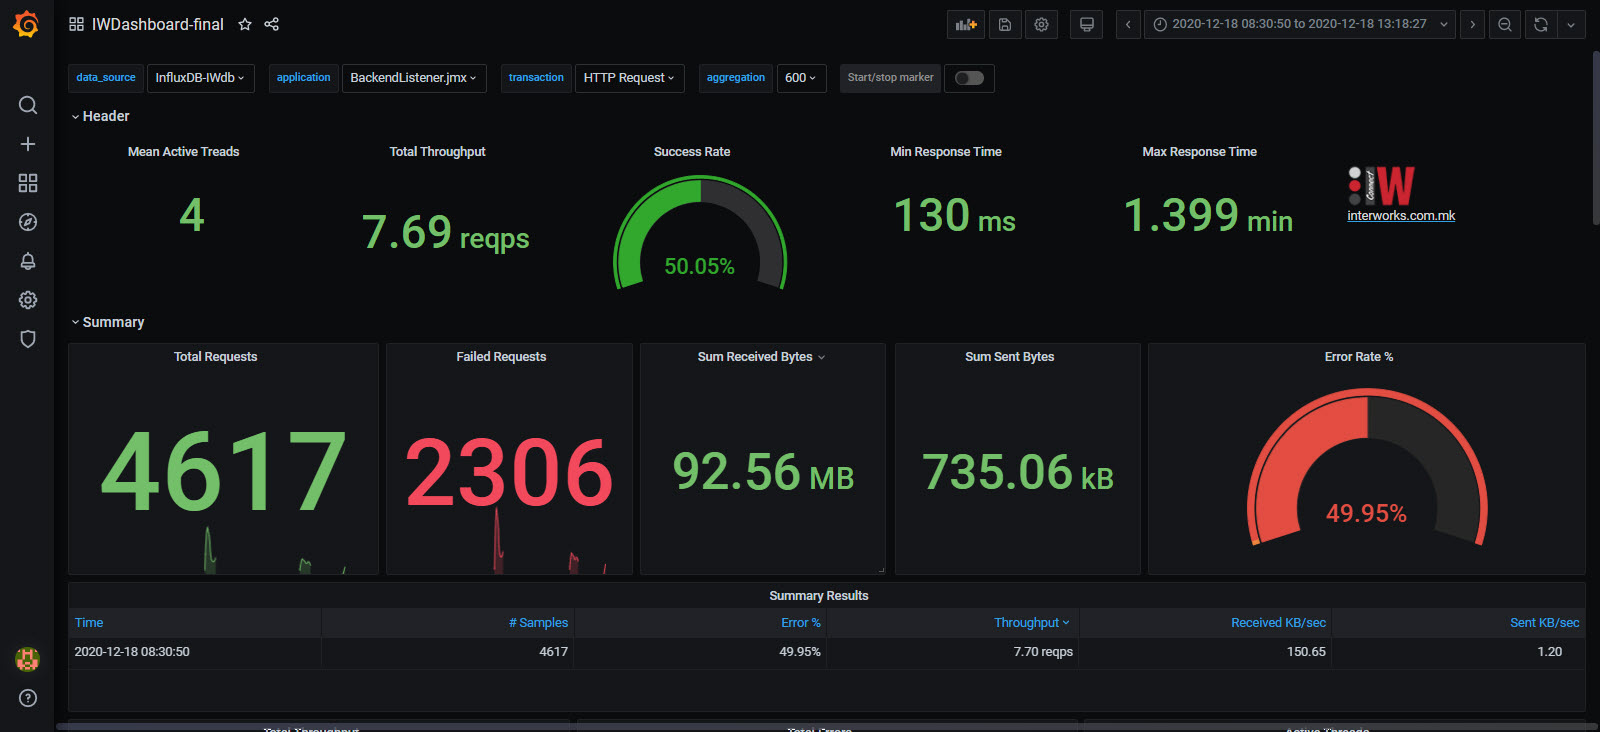
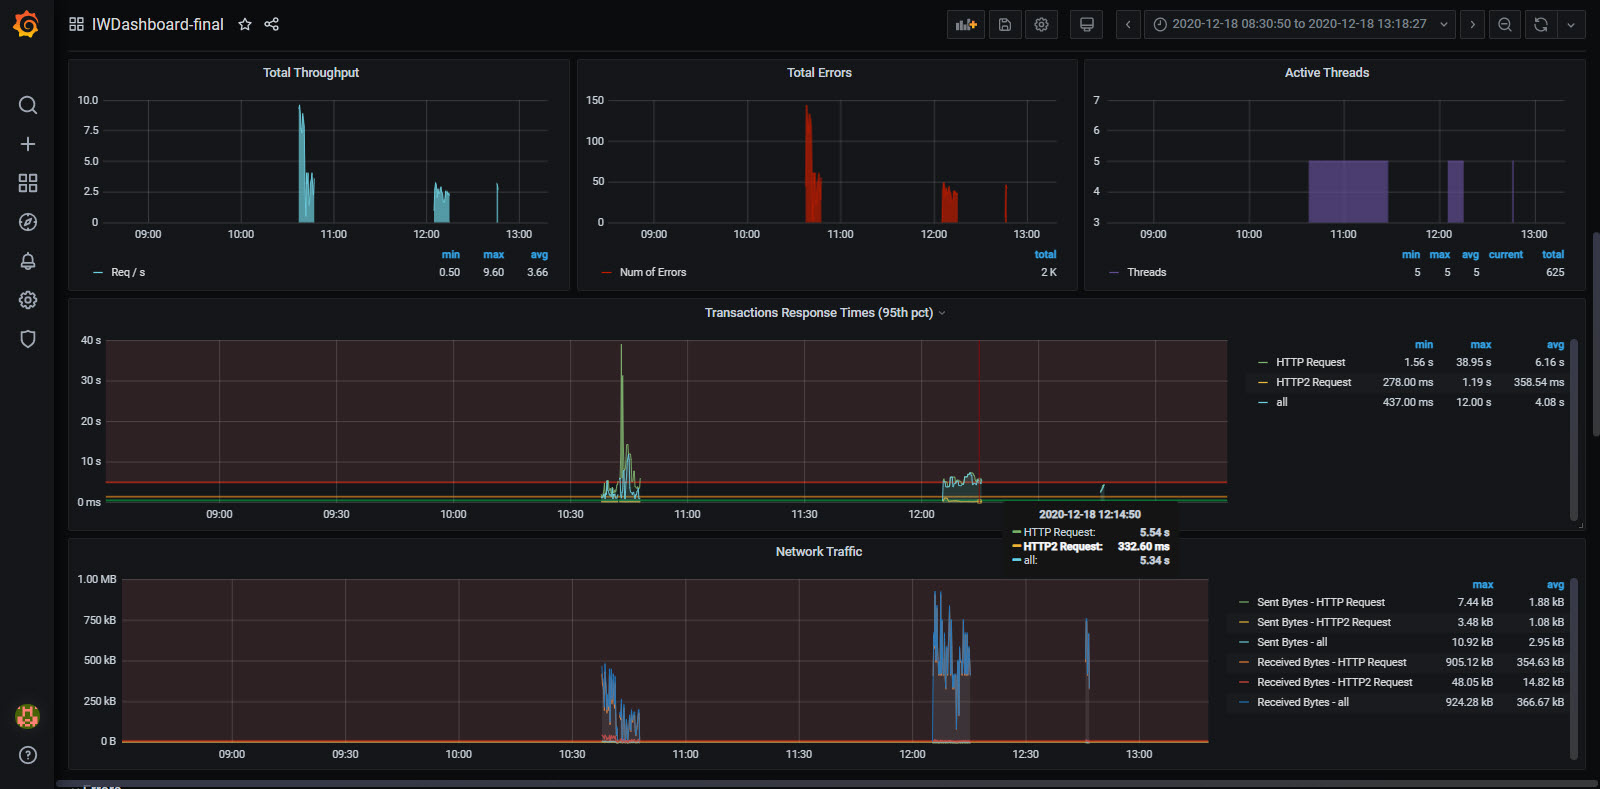
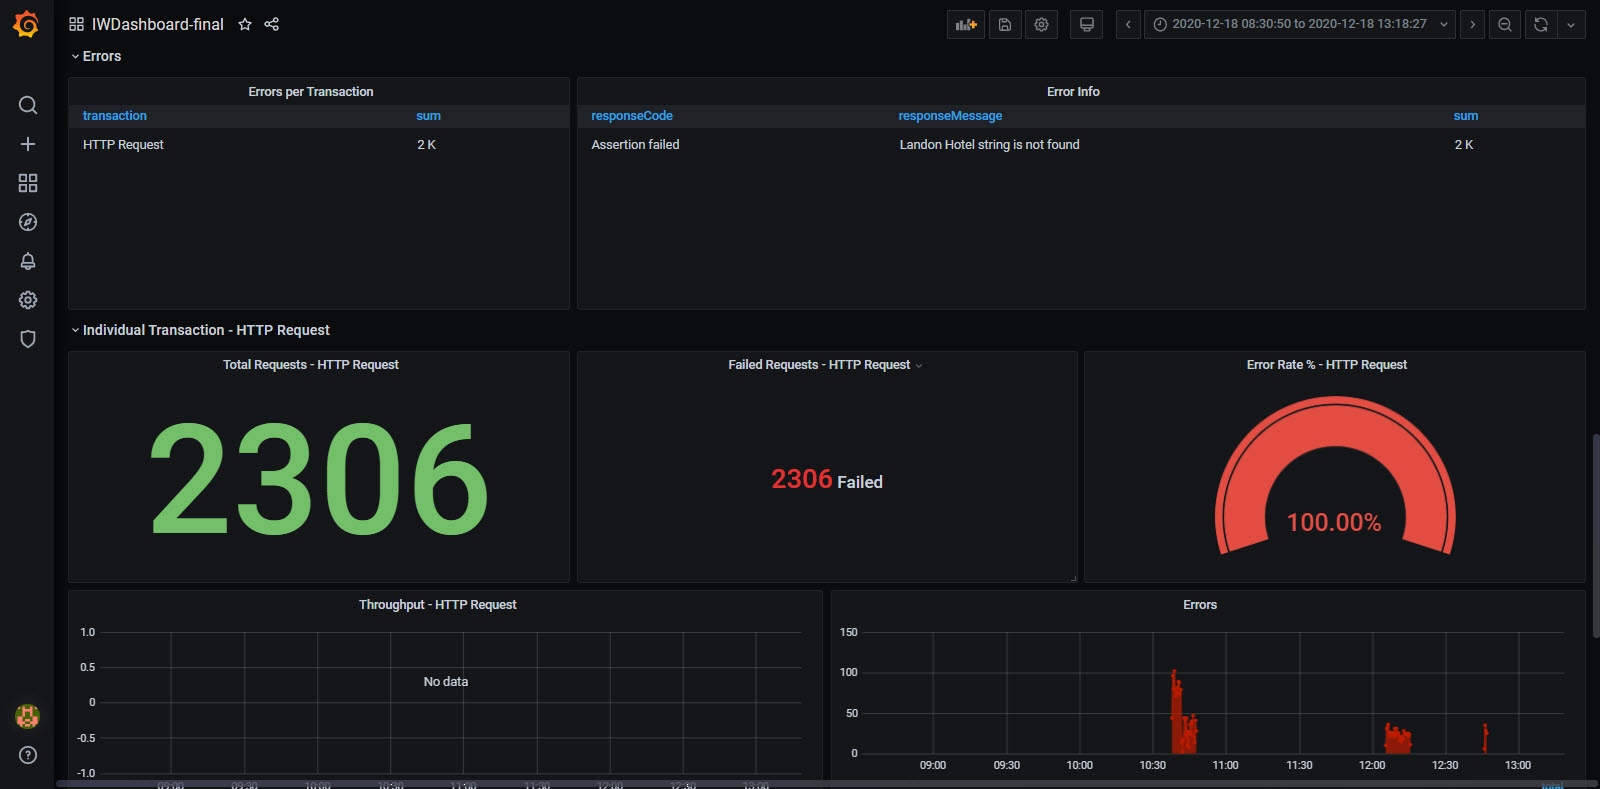
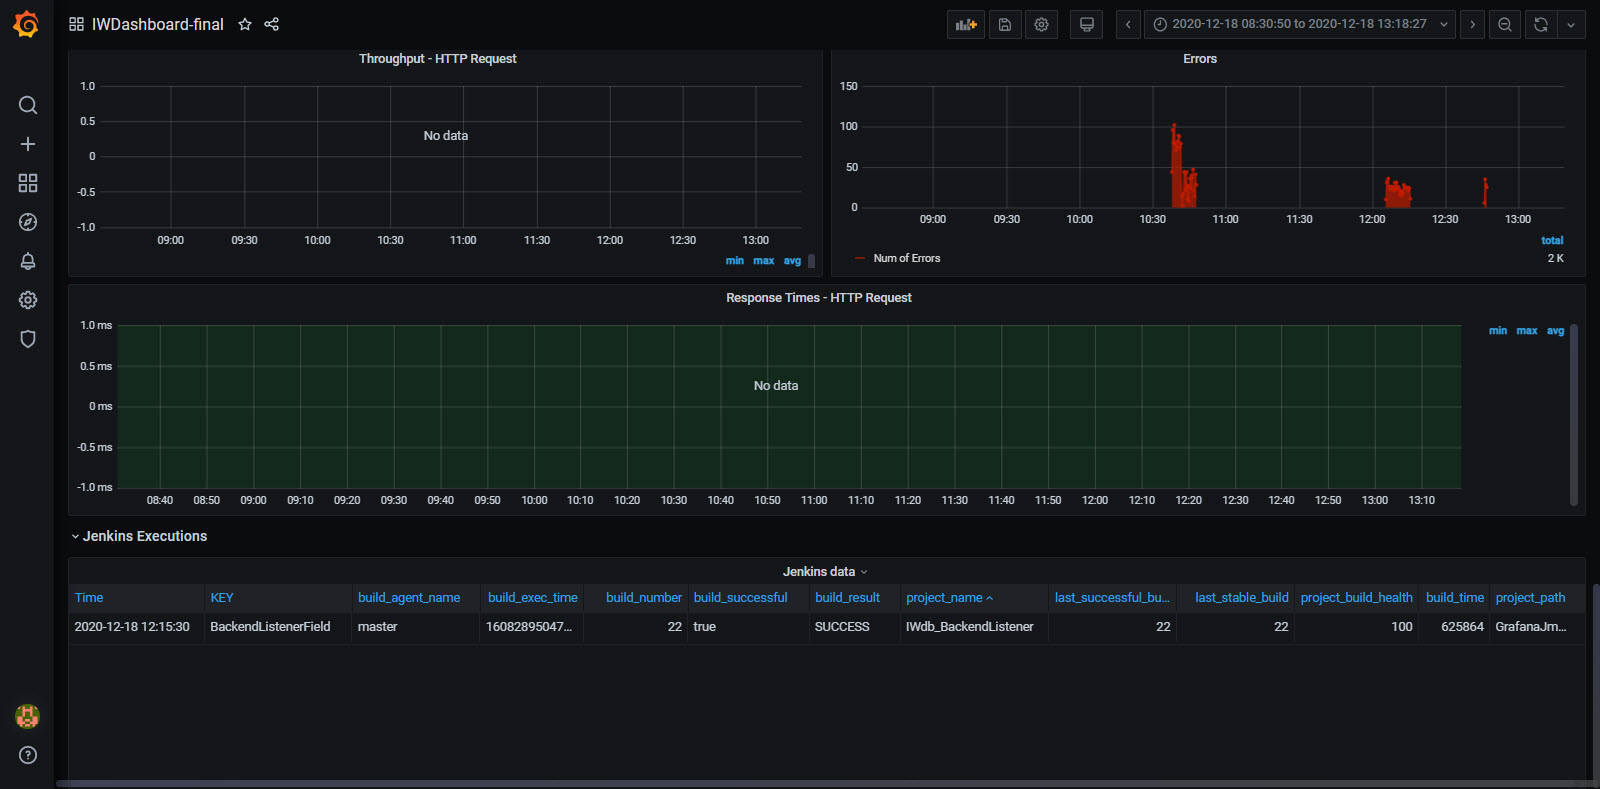
The IW dashboard template consists of several sections:
  •	Header
  •	Summary
  •	Errors
  •	Individual Transaction summary
  •	Jenkins Executions
The sections are divided into separate raw panels for the easy view (show/hide) of the panels. On the top are located the variables that can be selected for the display of the metrics. The variables are configured in the main Dashboard settings -> Variables and you can easily add new or remove existing:
• data_source (Type: Datasource - Enable you to dynamically switch the data source for multiple panels). It is set to InfluxDB data source because for this Dashboard we use InfluxDB but if you use other data source (Prometheus, MySQL, Elasticsearch, Microsoft SQL Server, etc) you can easily change it from here – but first, you need to have added that Data Source and establish the connection in the main Grafana configuration settings.
• application (Type: Query - Variable values are fetched from a data source query) It is set to get all the values for application tag key from the configured data_source: SHOW TAG VALUES FROM "$measurement_name" WITH KEY = "application" (this is set in JMeter Backend listener and my practice is to set its value as TestPlanName)
• transaction (Type: Query - Variable values are fetched from a datasource query) It is set to get all the values for transaction tag key for the choosen application (test plan) with the following query: SHOW TAG VALUES FROM "$measurement_name" WITH KEY = "transaction" WHERE "application" =~ /^$application$/ AND "transaction" != 'internal' AND "transaction" != 'all' – this will show all the samples run in the test plan.
• measurement_name (Type: Constant - Define a hidden constant variable, useful for metric prefixes in dashboards you want to share). This variable value is set to “jmeter” as constant – but if you set a different name in the Backend Listener for measurement name you need to change it here.
• send_interval (Type: Constant - Define a hidden constant variable, useful for metric prefixes in dashboards you want to share). This variable value is set to 5, because Backend Listener’s default send interval value is 5 seconds. If you choose to change that – you can do that in the jmeter.properties  (properties file in JMeter bin location) in the section for Influx Backend (backend_influxdb.send_interval=5)
• aggregation (Type: Custom - Define variable values manually). Here we set the test duration time in seconds. Several values are added 1,10,30,60,600,1800,3600 but if you run the test for a longer time or other than that specified you can add it here and it will be shown in the drop-down menu and be able to select in the dashboard. It is an important value for calculating the metrics in the Dashboard panels.
The Jenkins Executions section is a section where we can see all the data for the Jenkins run: when was the job executed, duration of the build, status of the build, last stable or successful build and etc. To have these data in InfluxDB you need to add the InfluxDB plugin (https://plugins.jenkins.io/influxdb/) in Jenkins in order to send these data to the database, and then to use Post-Build Action “Publish build data to InfluxDB” in the configuration of the build
Data source config
Collector config:
Upload an updated version of an exported dashboard.json file from Grafana
| Revision | Description | Created | |
|---|---|---|---|
| Download |


