
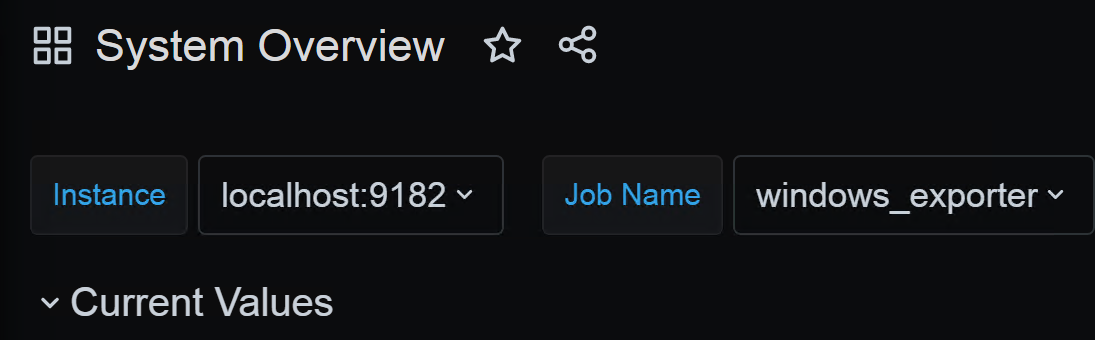
Windows System Overview
A dashboard utilizing metrics collected via "windows_exporter" for Prometheus.
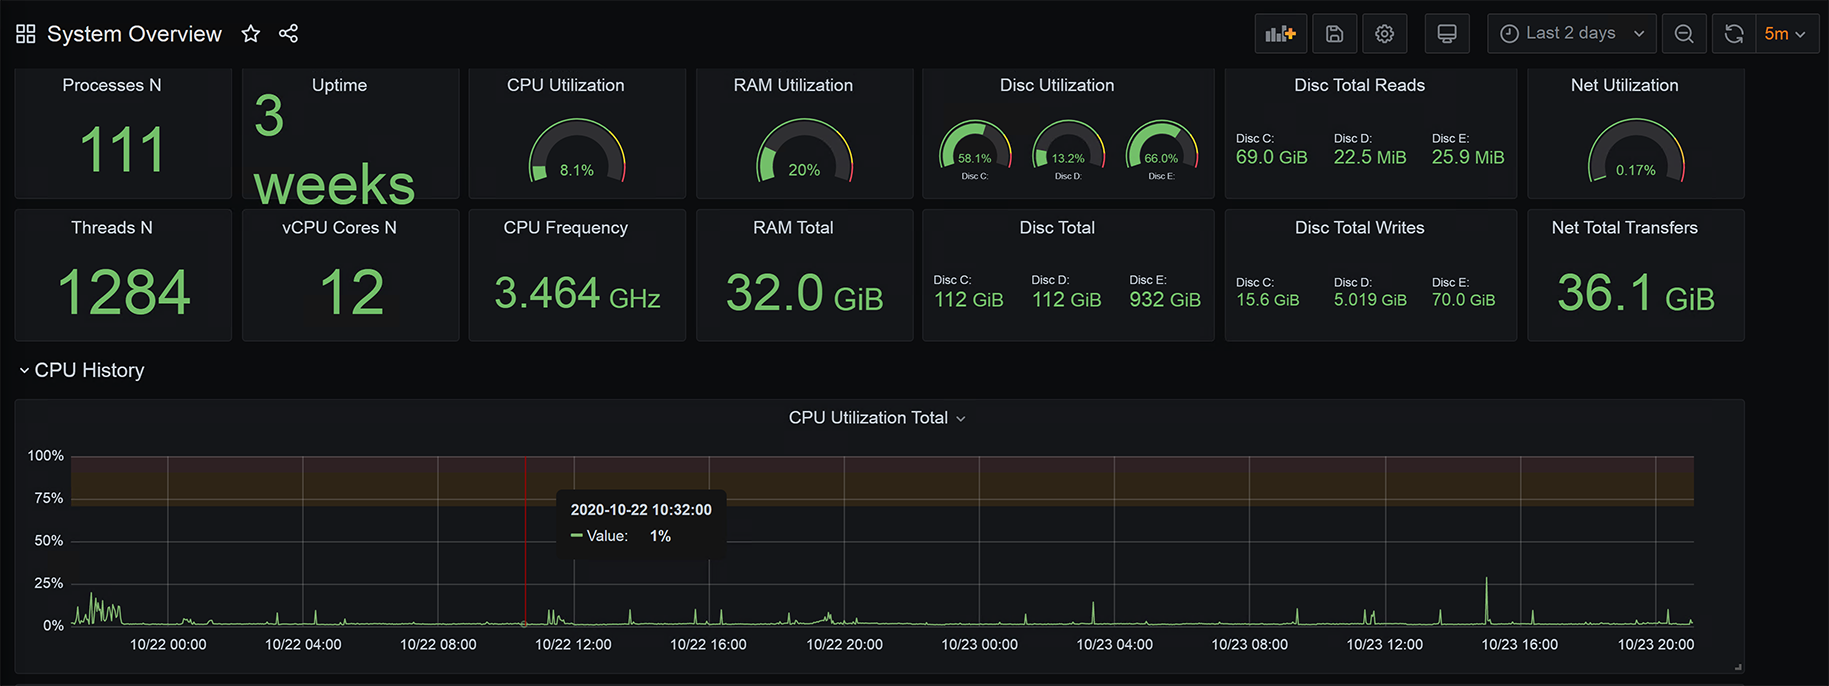
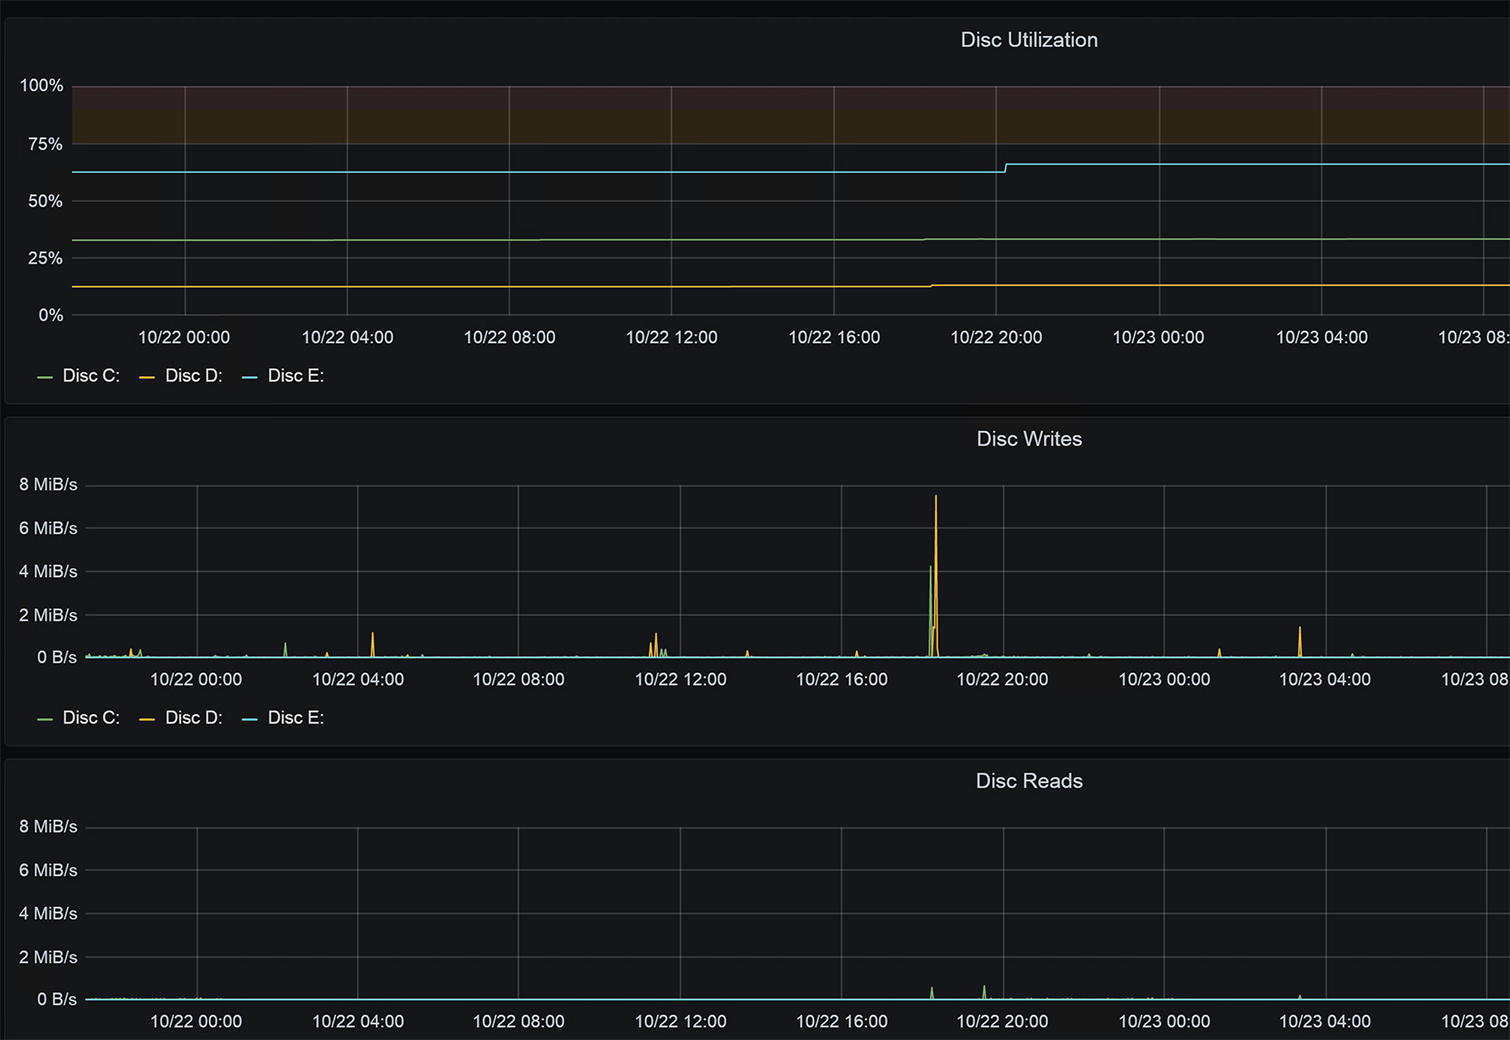
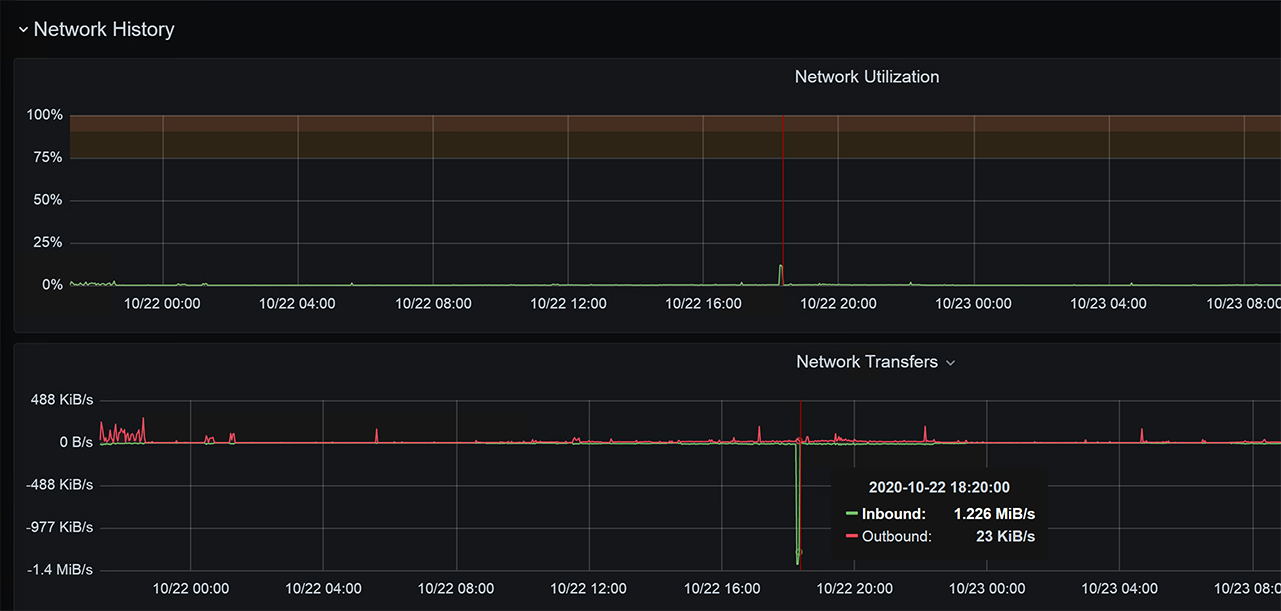
The dashboard provides a brief overview of the current system's metrics with graphs of their historic values.
Prometheus is used as the data source, which stores data collected from "windows_exporter".
Collectors of "windows_exporter" used:
cpucslogical_diskmemorynetossystem
See also: "Services & Processes" dashboard 13262 (https://grafana.com/grafana/dashboards/13262).
Data source config
Collector type:
Collector plugins:
Collector config:
Revisions
Upload an updated version of an exported dashboard.json file from Grafana
| Revision | Description | Created | |
|---|---|---|---|
| Download |
Windows
Easily monitor your deployment of the Windows operating system with Grafana Cloud's out-of-the-box monitoring solution.
Learn more