
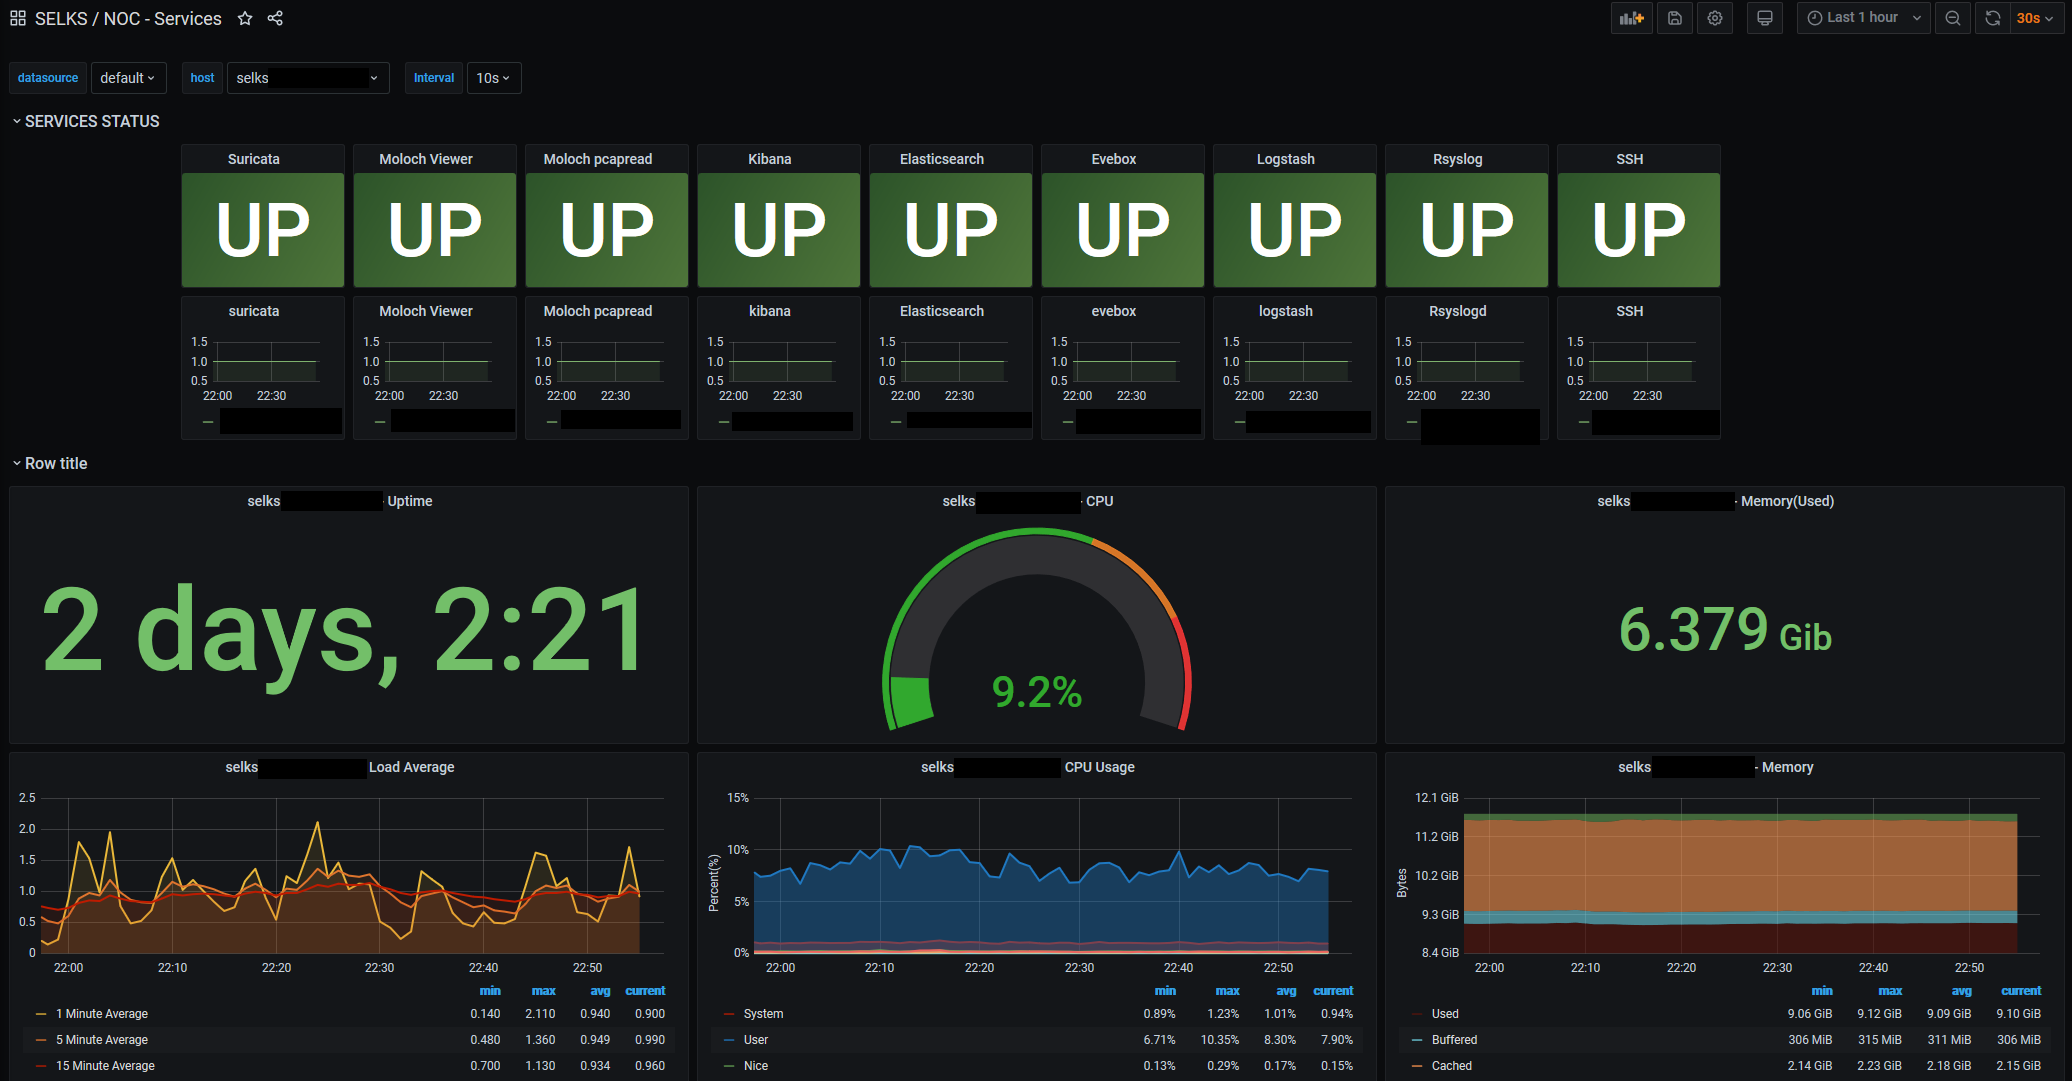
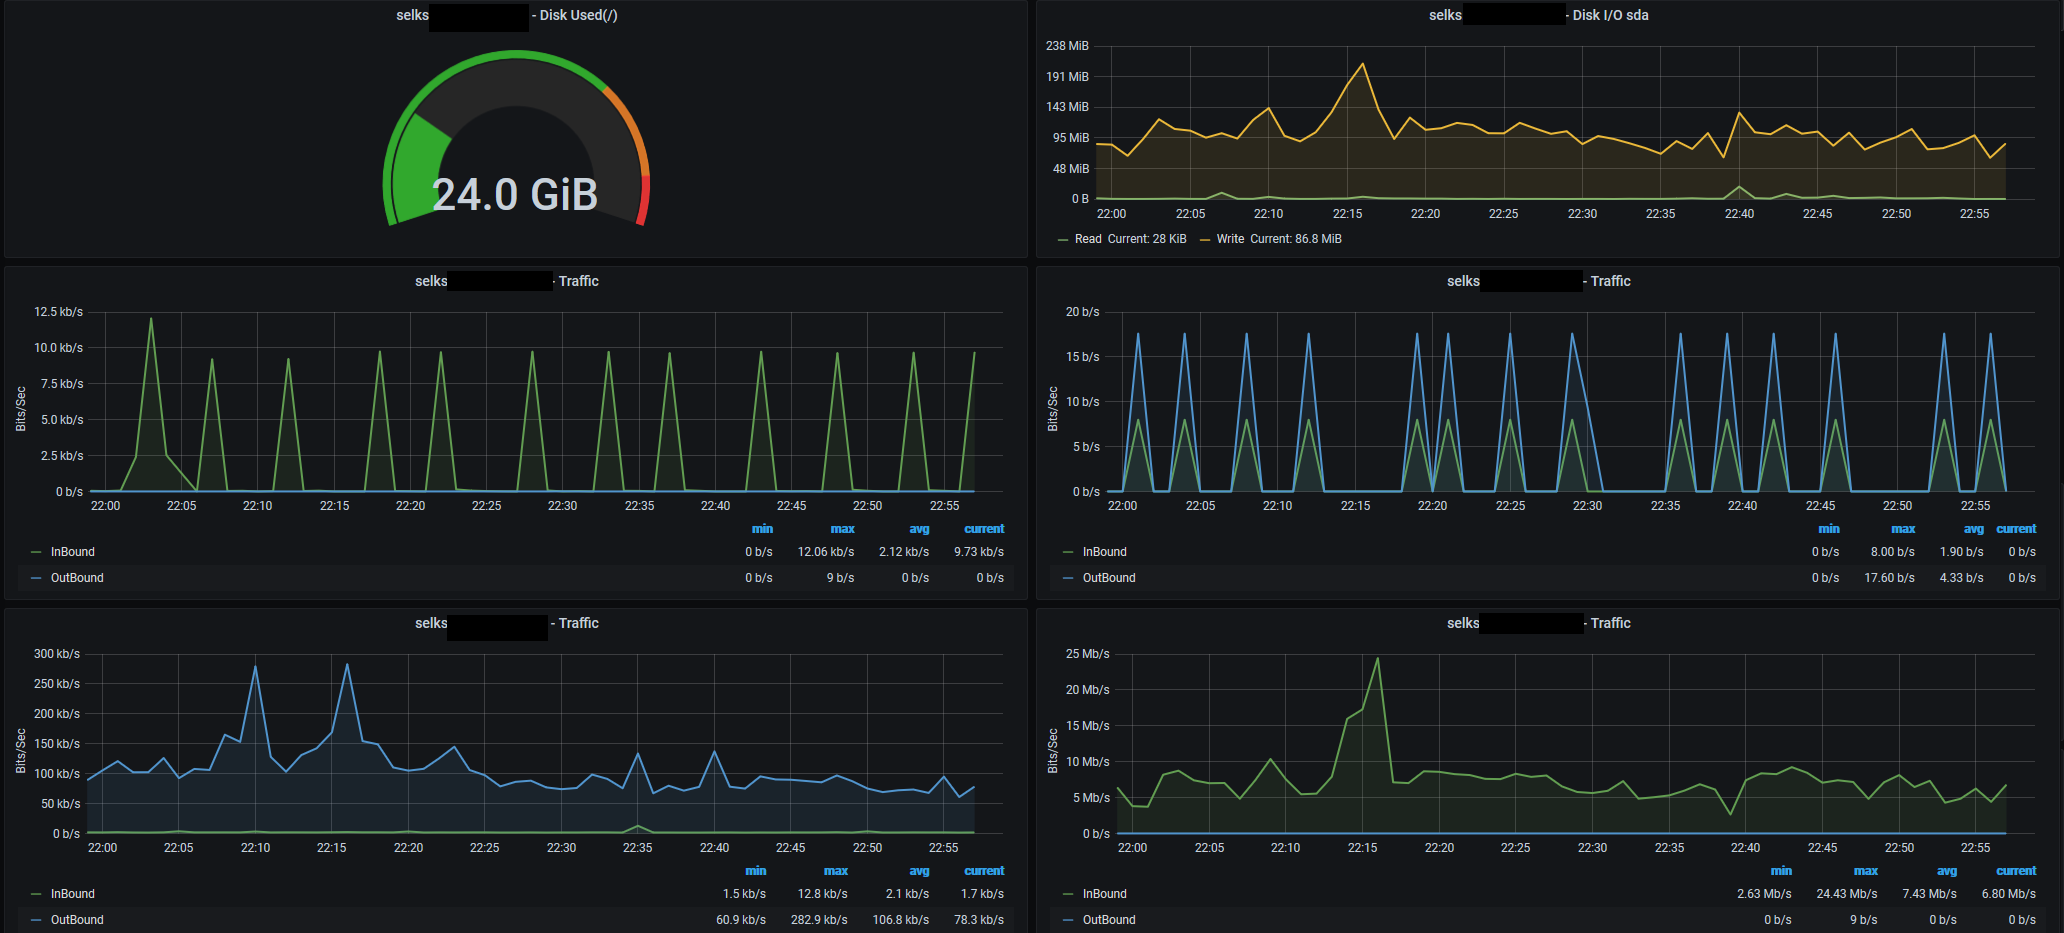
SELKS NOC - Services
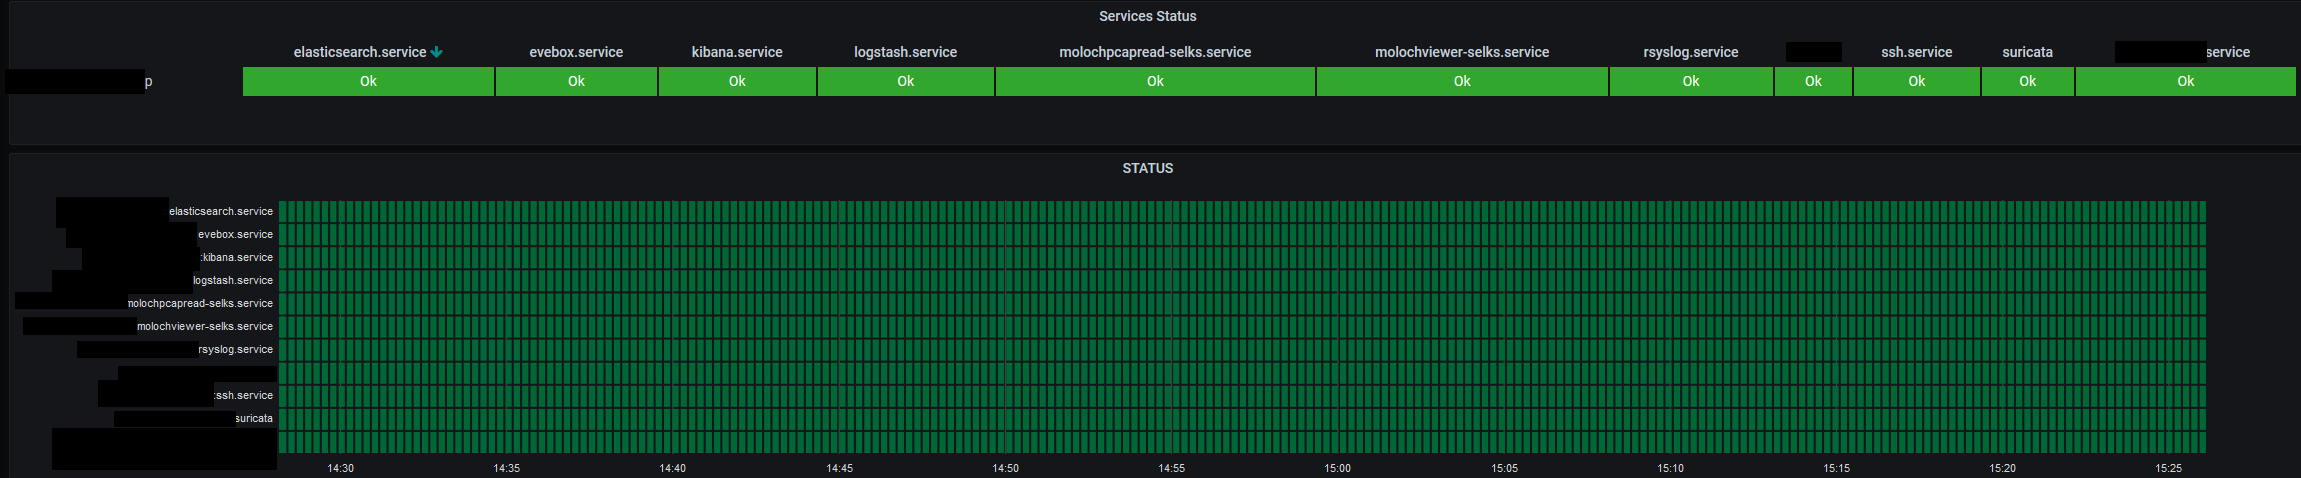
System services status
Follow the information here : https://github.com/b4b857f6ee/selks_grafana_dashboard And find more dashboard on the github repo Needed : https://www.stamus-networks.com/scirius-open-source
Configure telegraf with influxDB and this script : https://github.com/ratibor78/srvstatus Configuration of /opt/srvstatus/settings.ini
[SERVICES] name = ssh.service rsyslog.service suricata.service elasticsearch.service logstash.service kibana.service evebox.service molochviewer-selks.service molochpcapread-selks.service
Data source config
Collector type:
Collector plugins:
Collector config:
Revisions
Upload an updated version of an exported dashboard.json file from Grafana
| Revision | Description | Created | |
|---|---|---|---|
| Download |