
Loki Dashboard
Loki dashboard with quick search and timeline.
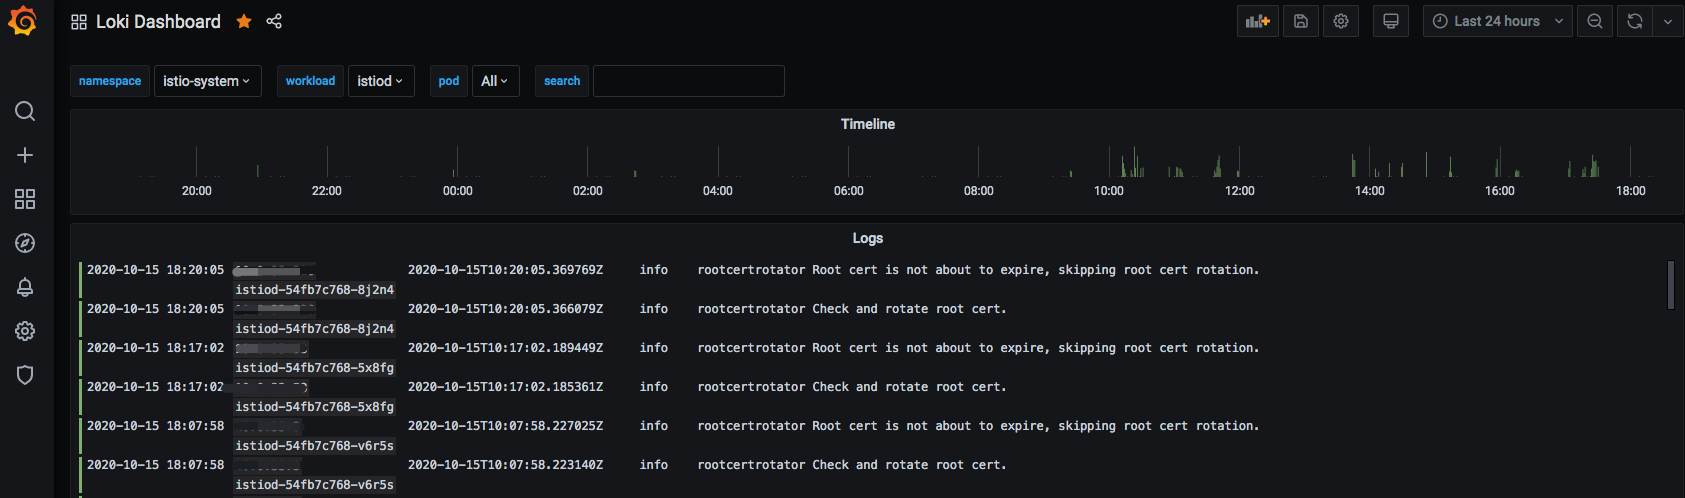
A Loki dashboard with quick search and timeline.
Features
- filter by namespace/workload/pod
- search with regex
- timeline
- logs
Data source config
Collector type:
Collector plugins:
Collector config:
Revisions
Upload an updated version of an exported dashboard.json file from Grafana
| Revision | Description | Created | |
|---|---|---|---|
| Download |
Grafana Loki (self-hosted)
Easily monitor Grafana Loki (self-hosted), a horizontally scalable, highly available, multi-tenant log aggregation system inspired by Prometheus, with Grafana Cloud's out-of-the-box monitoring solution.
Learn more