
Hazelcast Default
Dashboard for monitoring Hazelcast IMDG clusters.
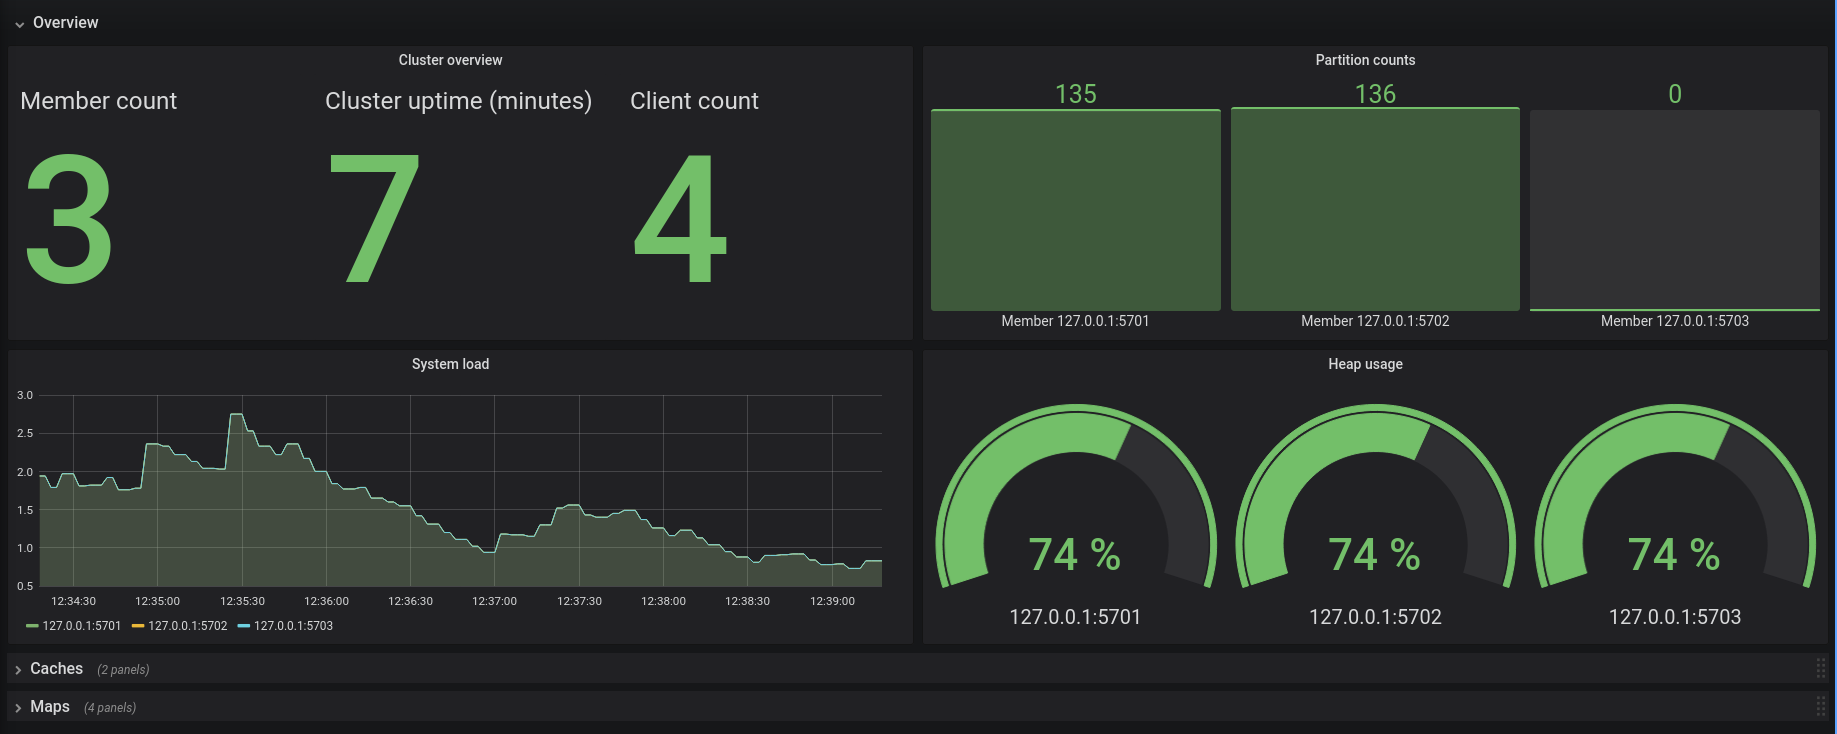
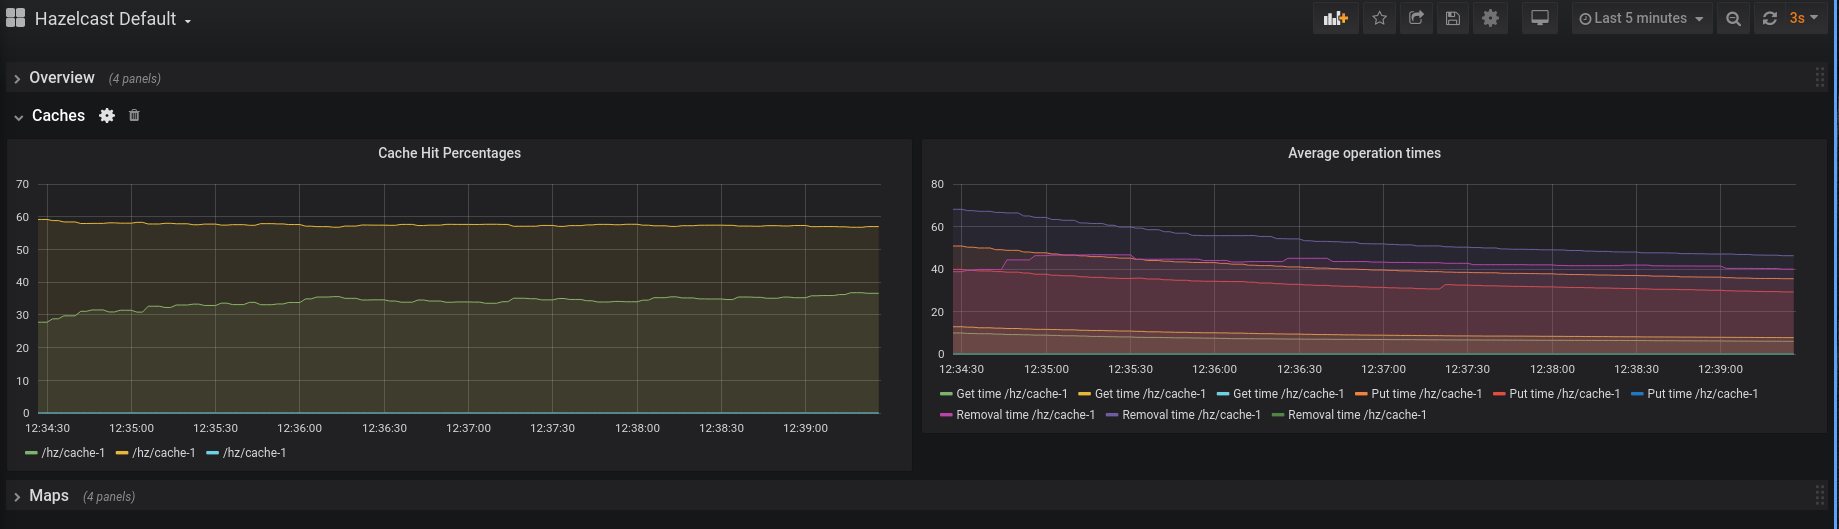
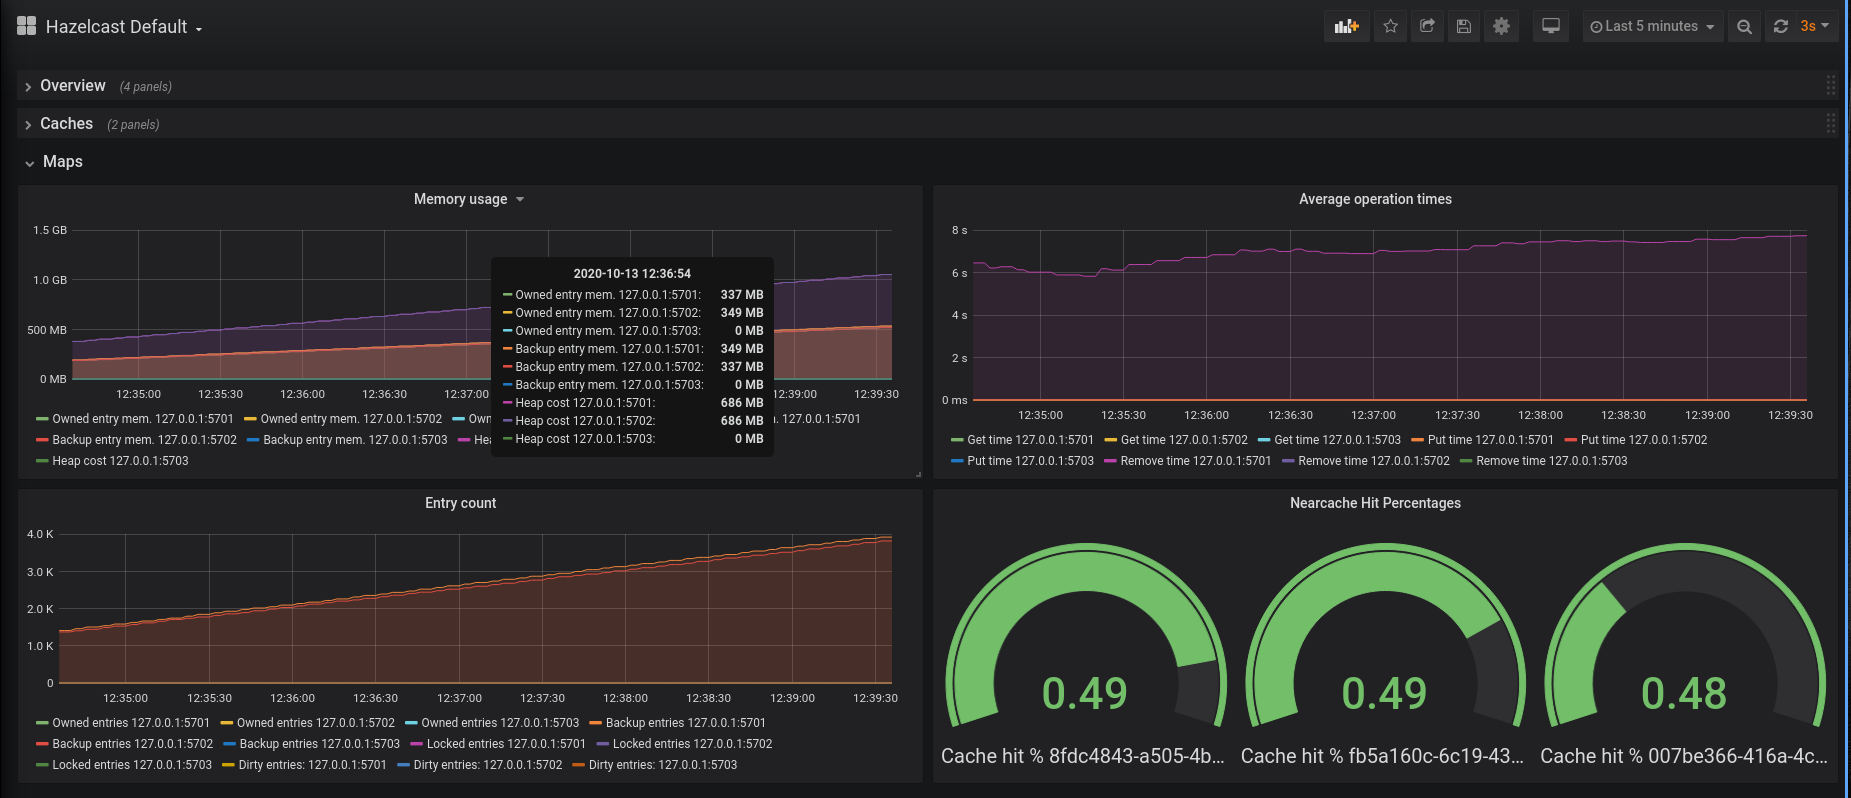
This dashboard visualizes common metrics received from a Prometheus instance which is connected to a Hazelcast Management Center instance. It displays general cluster information, and includes detail rows about IMaps and Caches.
You can read more about this feature here: https://hazelcast.com/blog/monitoring-hazelcast-with-prometheus-using-management-center-4-2020-8/
Data source config
Collector type:
Collector plugins:
Collector config:
Revisions
Upload an updated version of an exported dashboard.json file from Grafana
| Revision | Description | Created | |
|---|---|---|---|
| Download |