Traefik
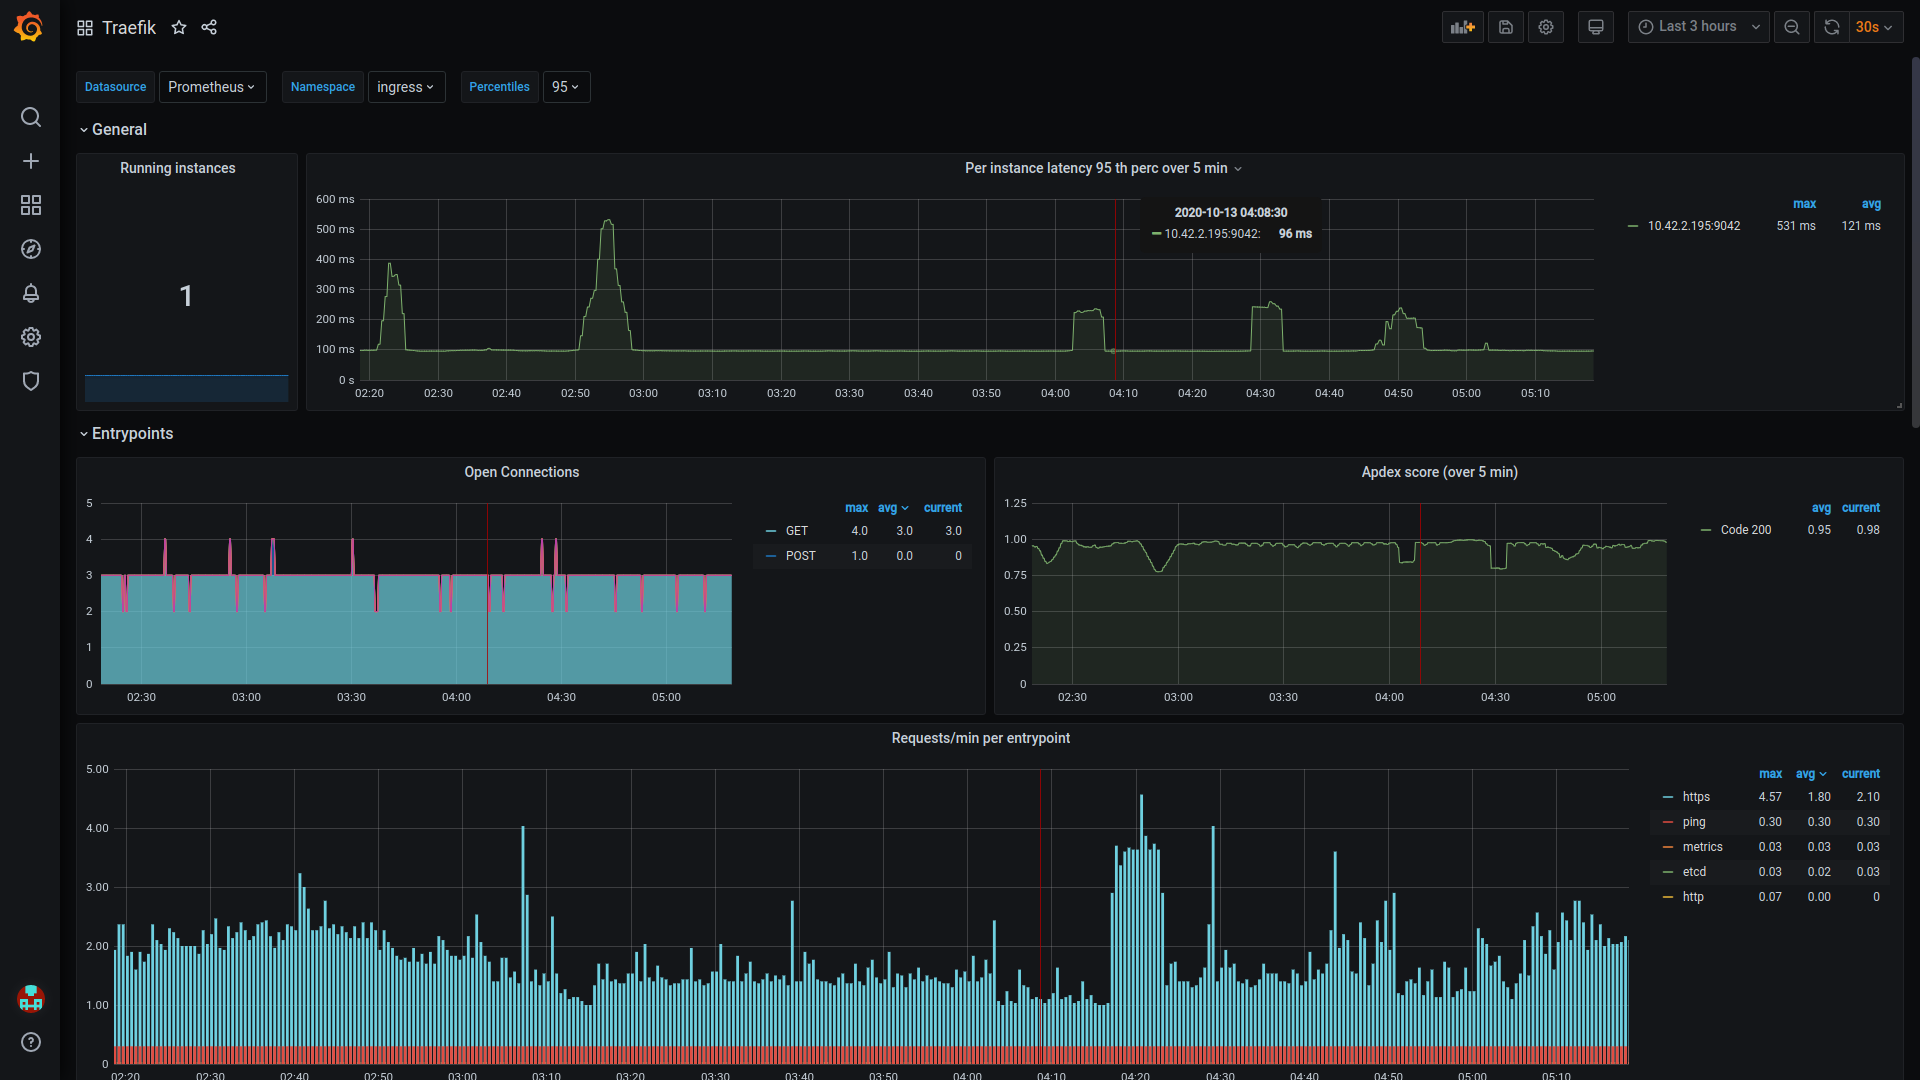
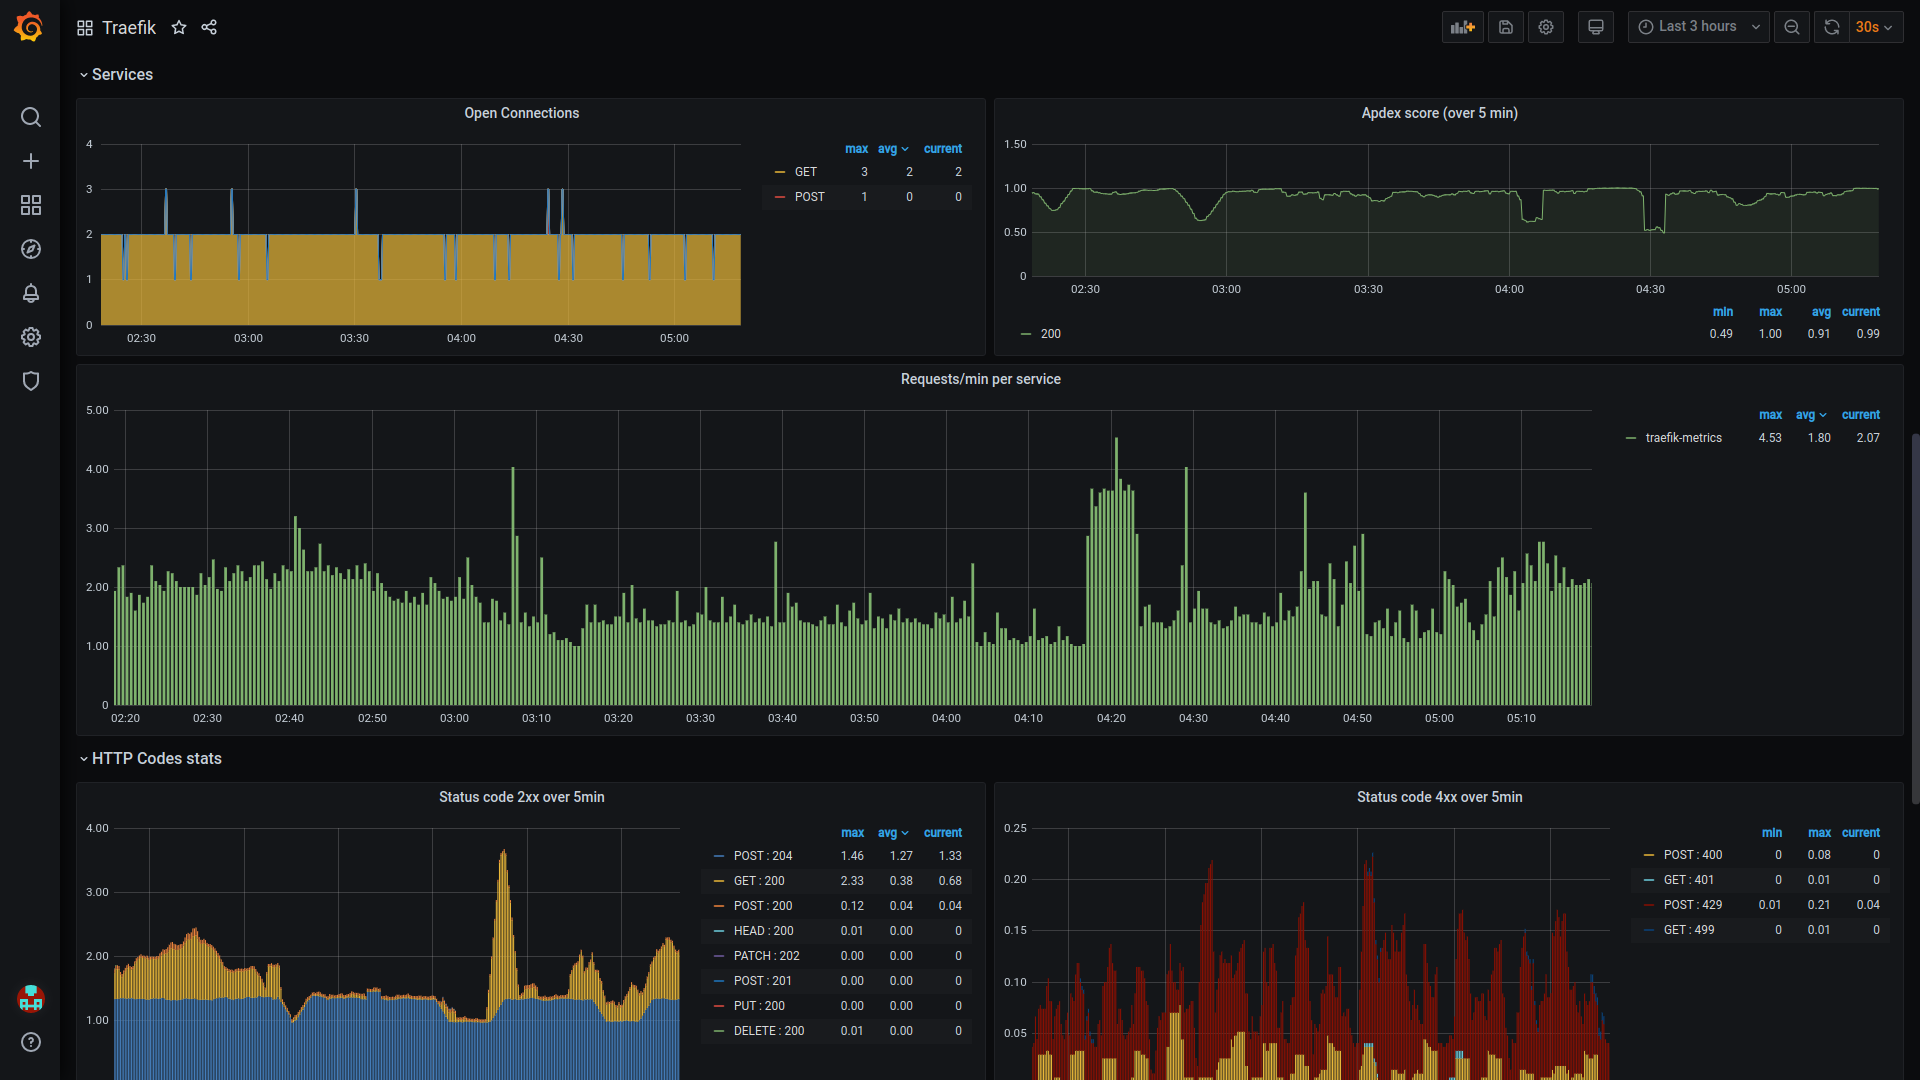
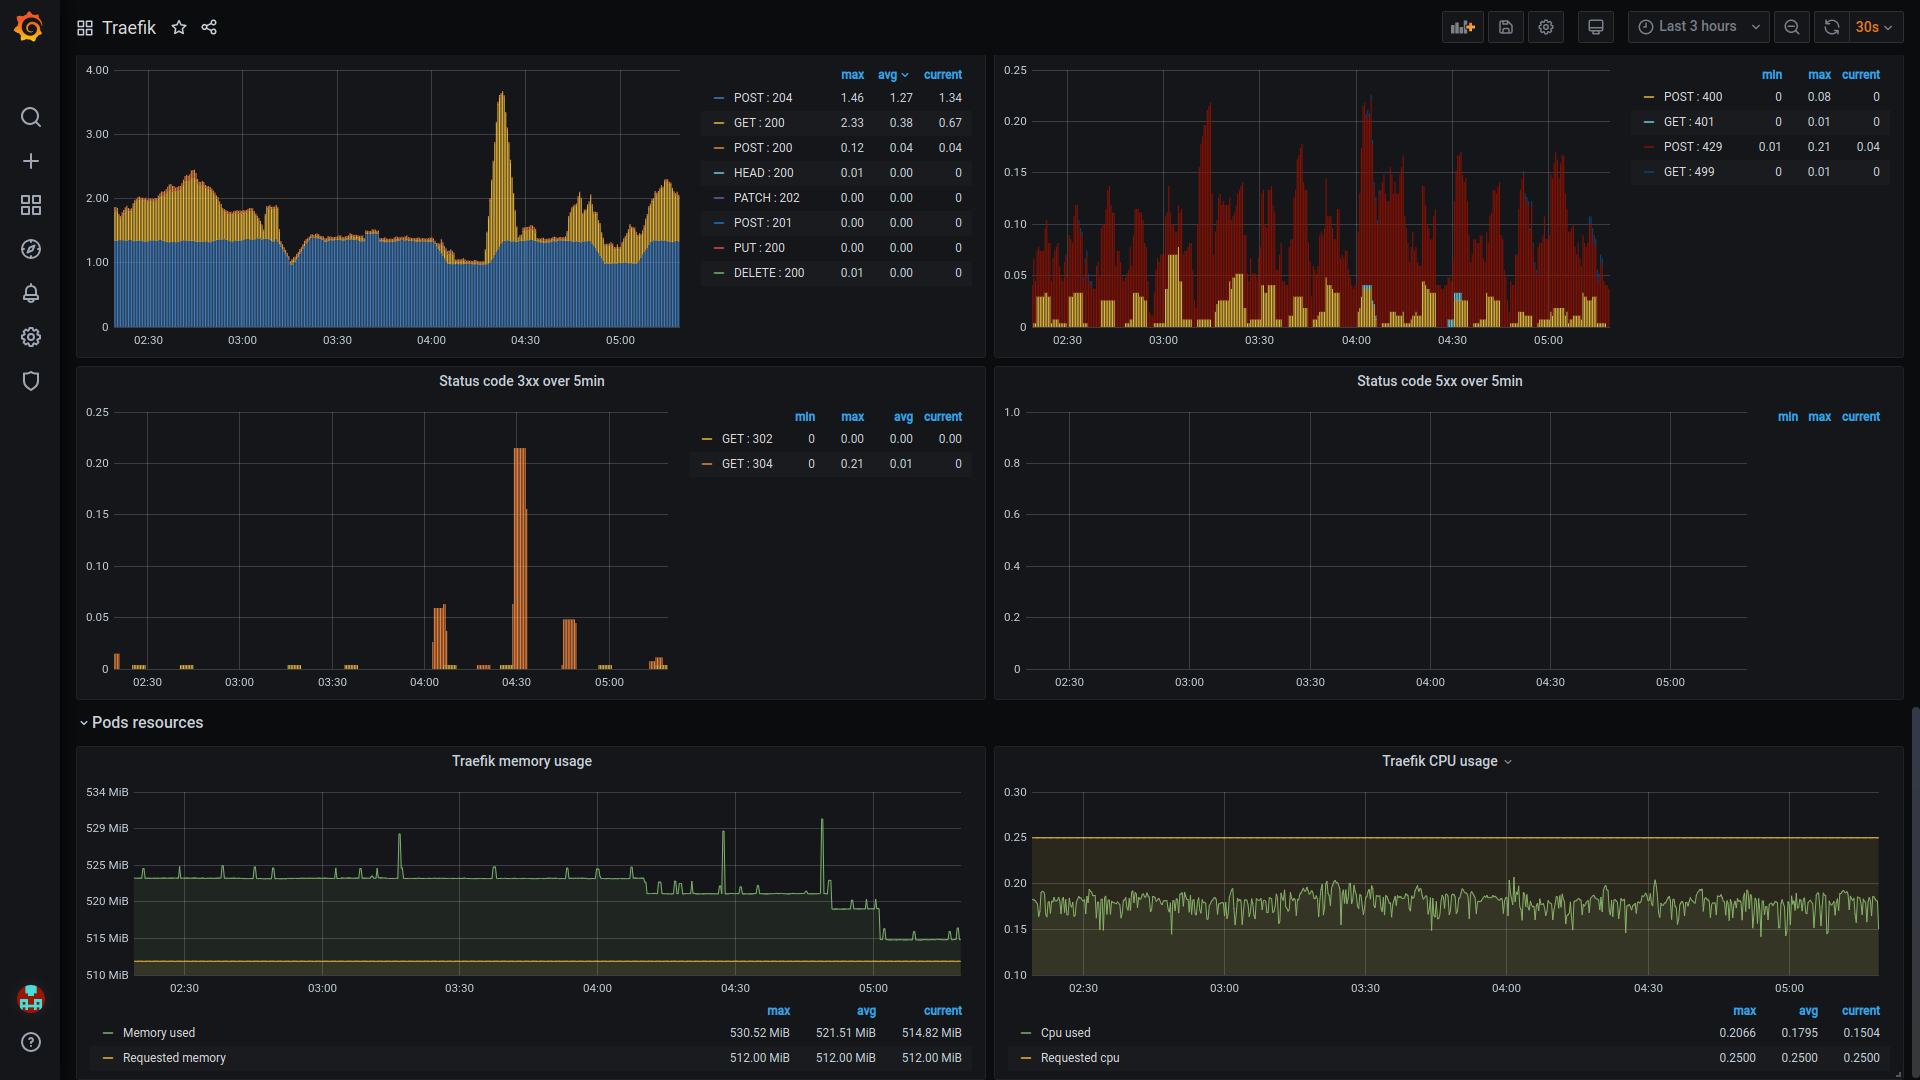
Traefik metrics overview
Traefik v2 (Kubernetes Ingress) metrics overview with selectors:
- Datasource
- Namespace
- Percentile
Shows stats for:
- Connections
- Requests
- HTTP codes
- POD resources
Data source config
Collector config:
Upload an updated version of an exported dashboard.json file from Grafana
| Revision | Description | Created | |
|---|---|---|---|
| Download |
Traefik
Easily monitor Traefik, the dynamic load balancer, with Grafana Cloud's out-of-the-box monitoring solution.
Learn more


