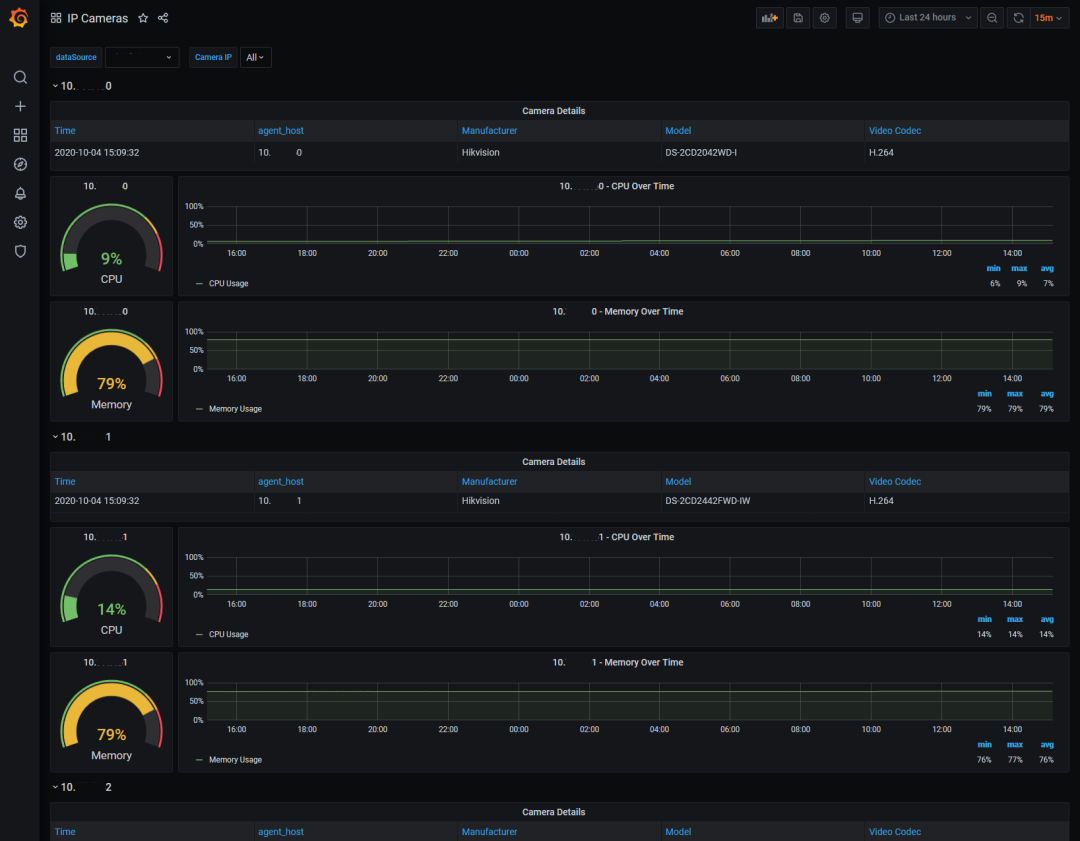
Hikvision IP Camera Dashboard
Hikvision IP Camera Dashboard
This is a Grafana dashboard to display information about your Hikvision IP Cameras. The Hikvision MIBs do not support a ton of useful information, but this dashboard does display the information I was looking to monitor.
This dashboard works with a telegraf collector which can be found over here.
The graphs are dynamic and change based on the number of cameras you are collecting data on. Additionally you can view a single camera, a few cameras, or all cameras based on the variable selected at the top of the dashboard in the "Camera IP" dropdown.
The dataSource variable you select at the top of the page will represent the hostname/IP address of the device you have your influxdb residing. This dashboard is setup to query the "snmp" measurement (more commonly known as a table in other databases) in the influx database.
If your data is stored in a different measurement (table), you will need to adjust that in the query section of the first camera table/gauges/graphs. Select only the first camera in the "Camera IP" drop down, make your changes to the query for each table/gauges/graphs in that section, and that change will propagate throughout the rest of the dynamically created table/gauges/graphs.
Statistics Displayed
Manufacturer
Device Model
CPU Percentage
Memory Percentage
Static IP
Video Encoding
Data source config
Collector config:
Upload an updated version of an exported dashboard.json file from Grafana
| Revision | Description | Created | |
|---|---|---|---|
| Download |

