
Azure Network Policy Dashboard based on Azure Monitor
Monitor and understand your Network Configuration. Uses a Prometheus Server data source.
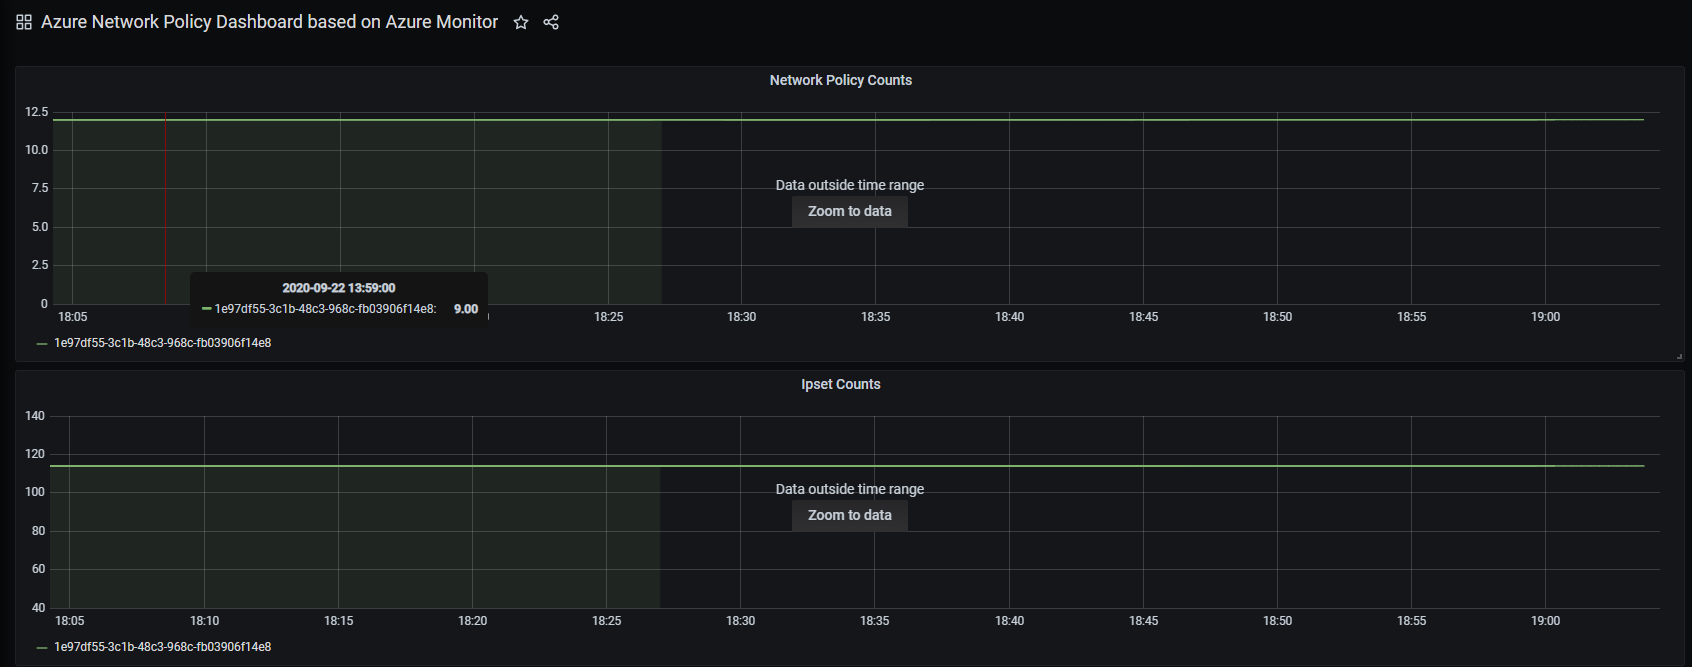
Azure Network Policy Metrics based on Azure Monitor
Azure Network Policy Manager (NPM) includes informative Prometheus metrics that allow you to monitor and better understand your configurations. We can view these metrics through Grafana dashboard.
Current Metrics
| Metric Name | Description | Prometheus Metric Type | Labels |
|---|---|---|---|
npm_num_policies | number of network policies | Gauge | - |
npm_num_iptables_rules | number of IPTables rules | Gauge | - |
npm_num_ipsets | number of IPSets | Gauge | - |
npm_num_ipset_entries | number of IP address entries in all IPSets | Gauge | - |
npm_add_policy_exec_time | runtime for adding a network policy | Summary | quantile (0.5, 0.9, or 0.99) |
npm_add_iptables_rule_exec_time | runtime for adding an IPTables rule | Summary | quantile (0.5, 0.9, or 0.99) |
npm_add_ipset_exec_time | runtime for adding an IPSet | Summary | quantile (0.5, 0.9, or 0.99) |
npm_ipset_counts (advanced) | number of entries within each individual IPSet | GaugeVec | set name & hash |
How it works?
- An AKS or AKS engine cluster with Azure Network Policy plugin.
- Container Insights enabled for cluster.
- Please refer this doc to enable Grafana dashboard from Azure Monitor log analytics data source
Contact
Data source config
Collector type:
Collector plugins:
Collector config:
Revisions
Upload an updated version of an exported dashboard.json file from Grafana
| Revision | Description | Created | |
|---|---|---|---|
| Download |
Azure Cosmos DB
With the Grafana plugin for Azure Cosmos DB, you can quickly visualize and query your Azure Cosmos DB data from within Grafana.
Learn more