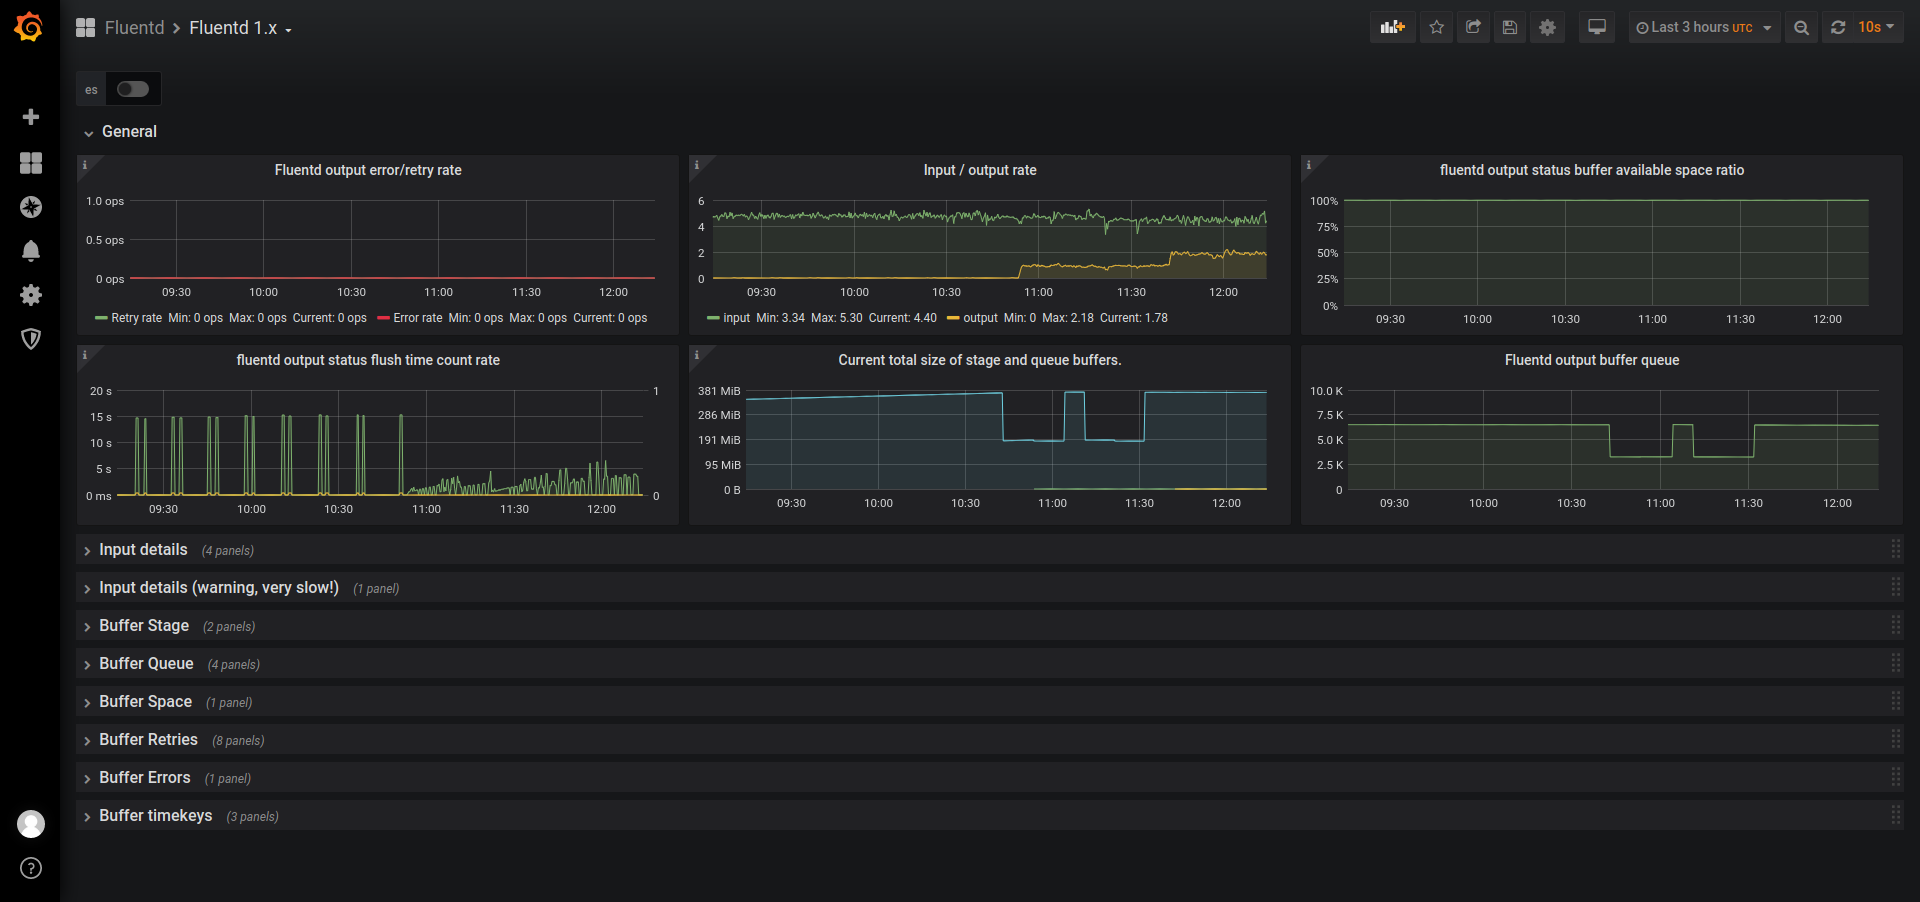
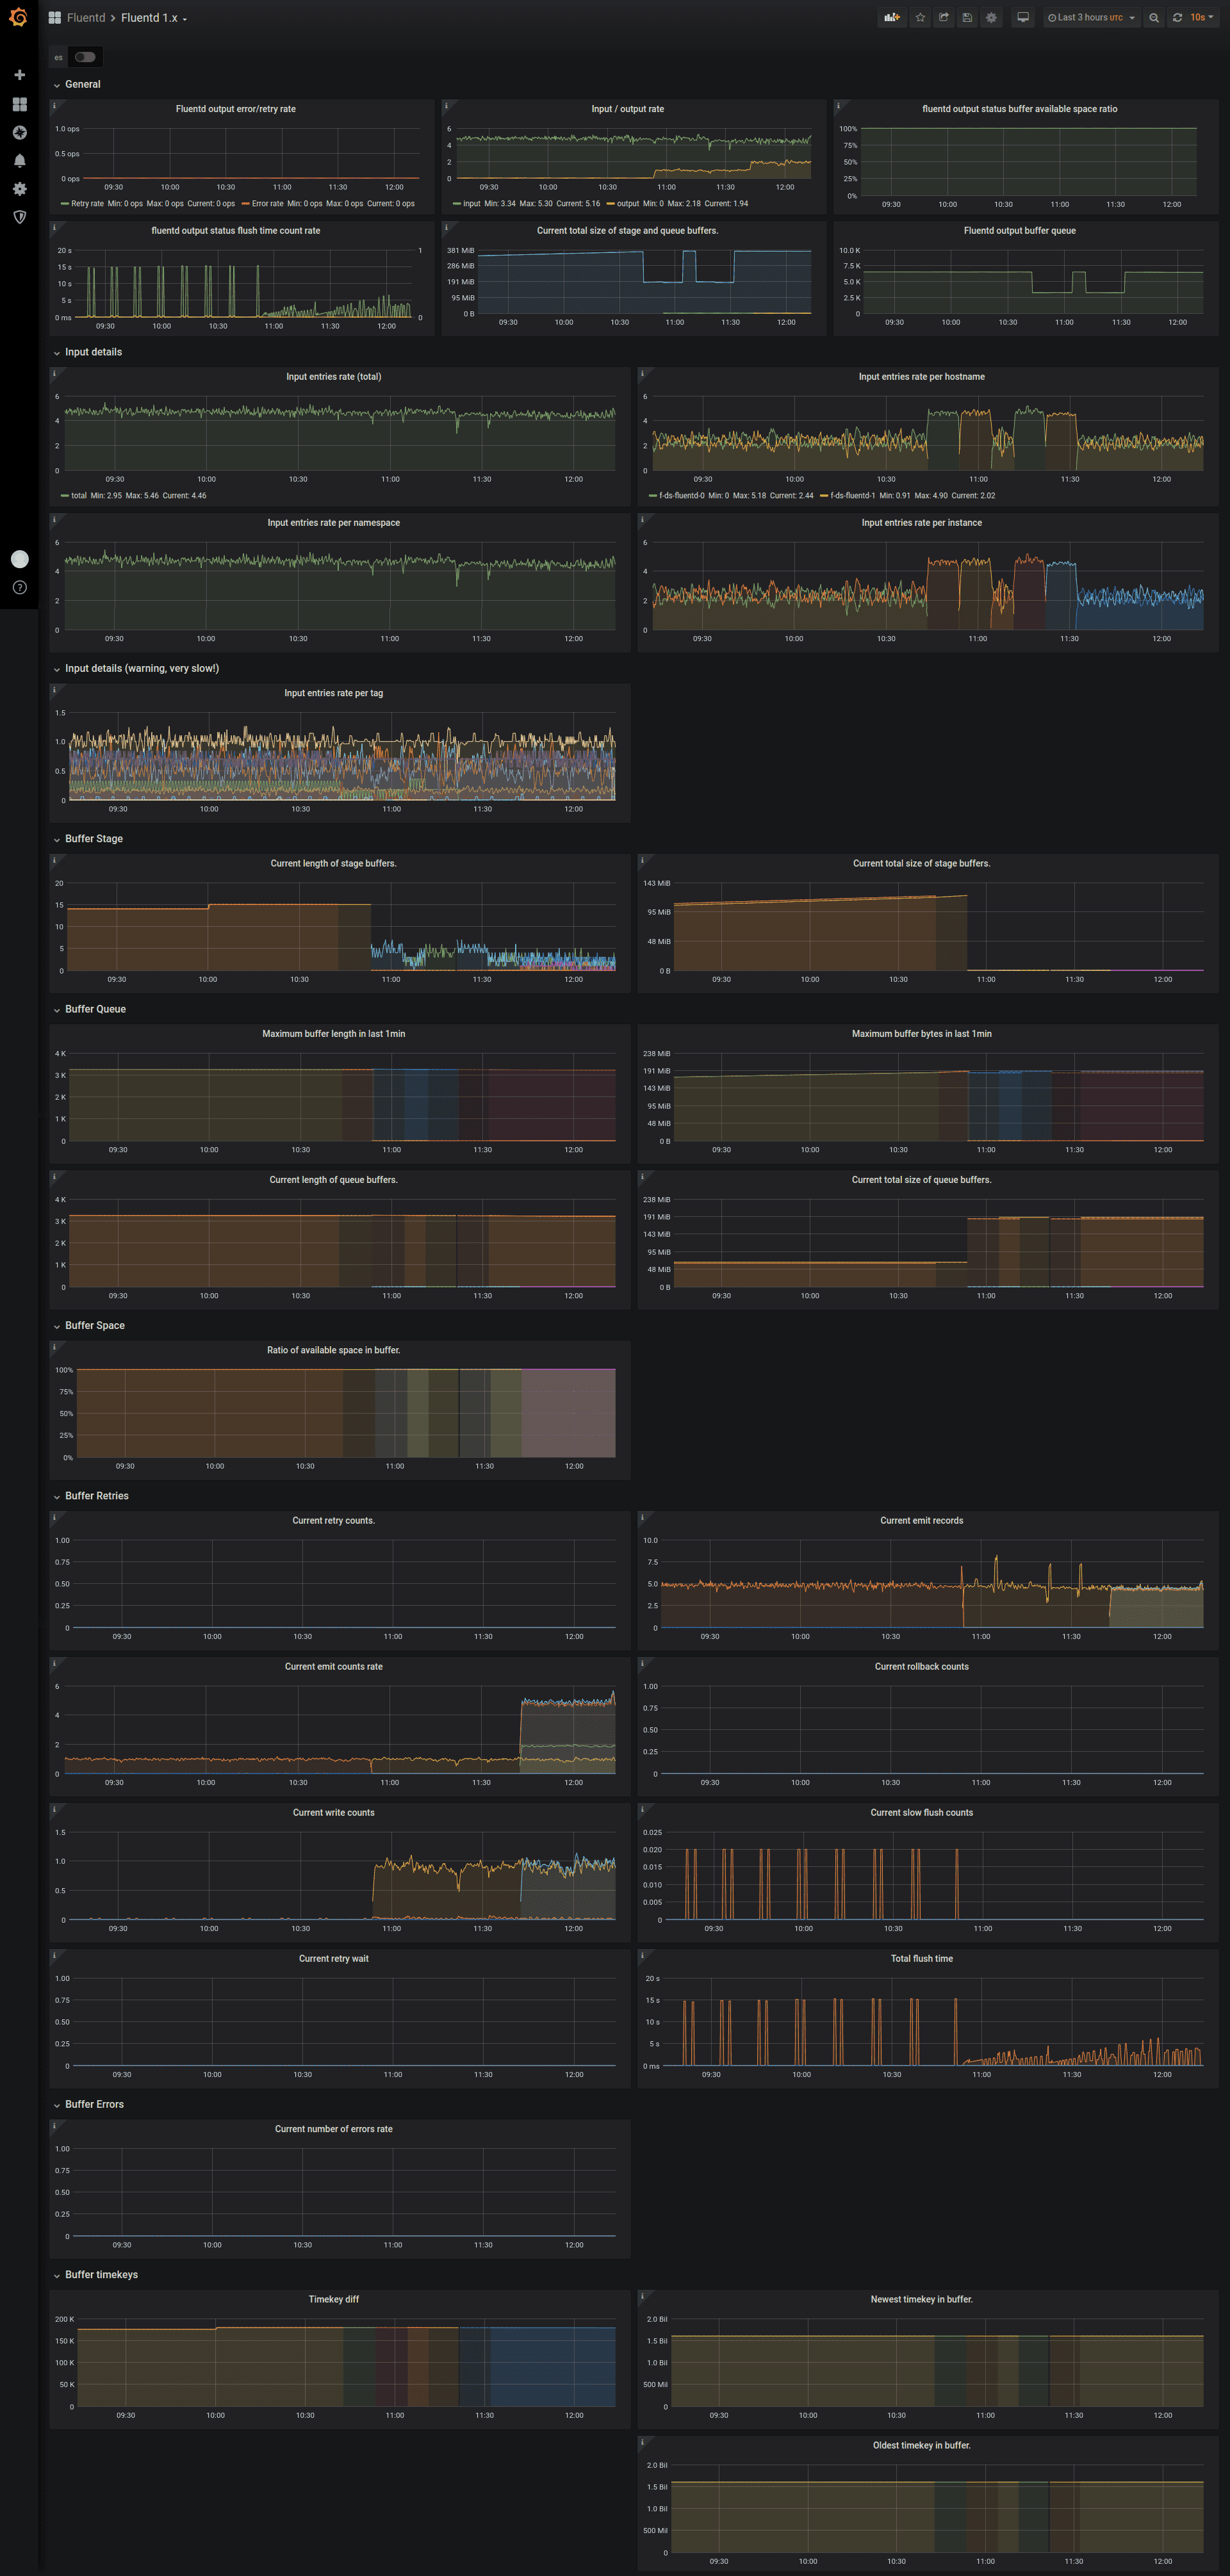
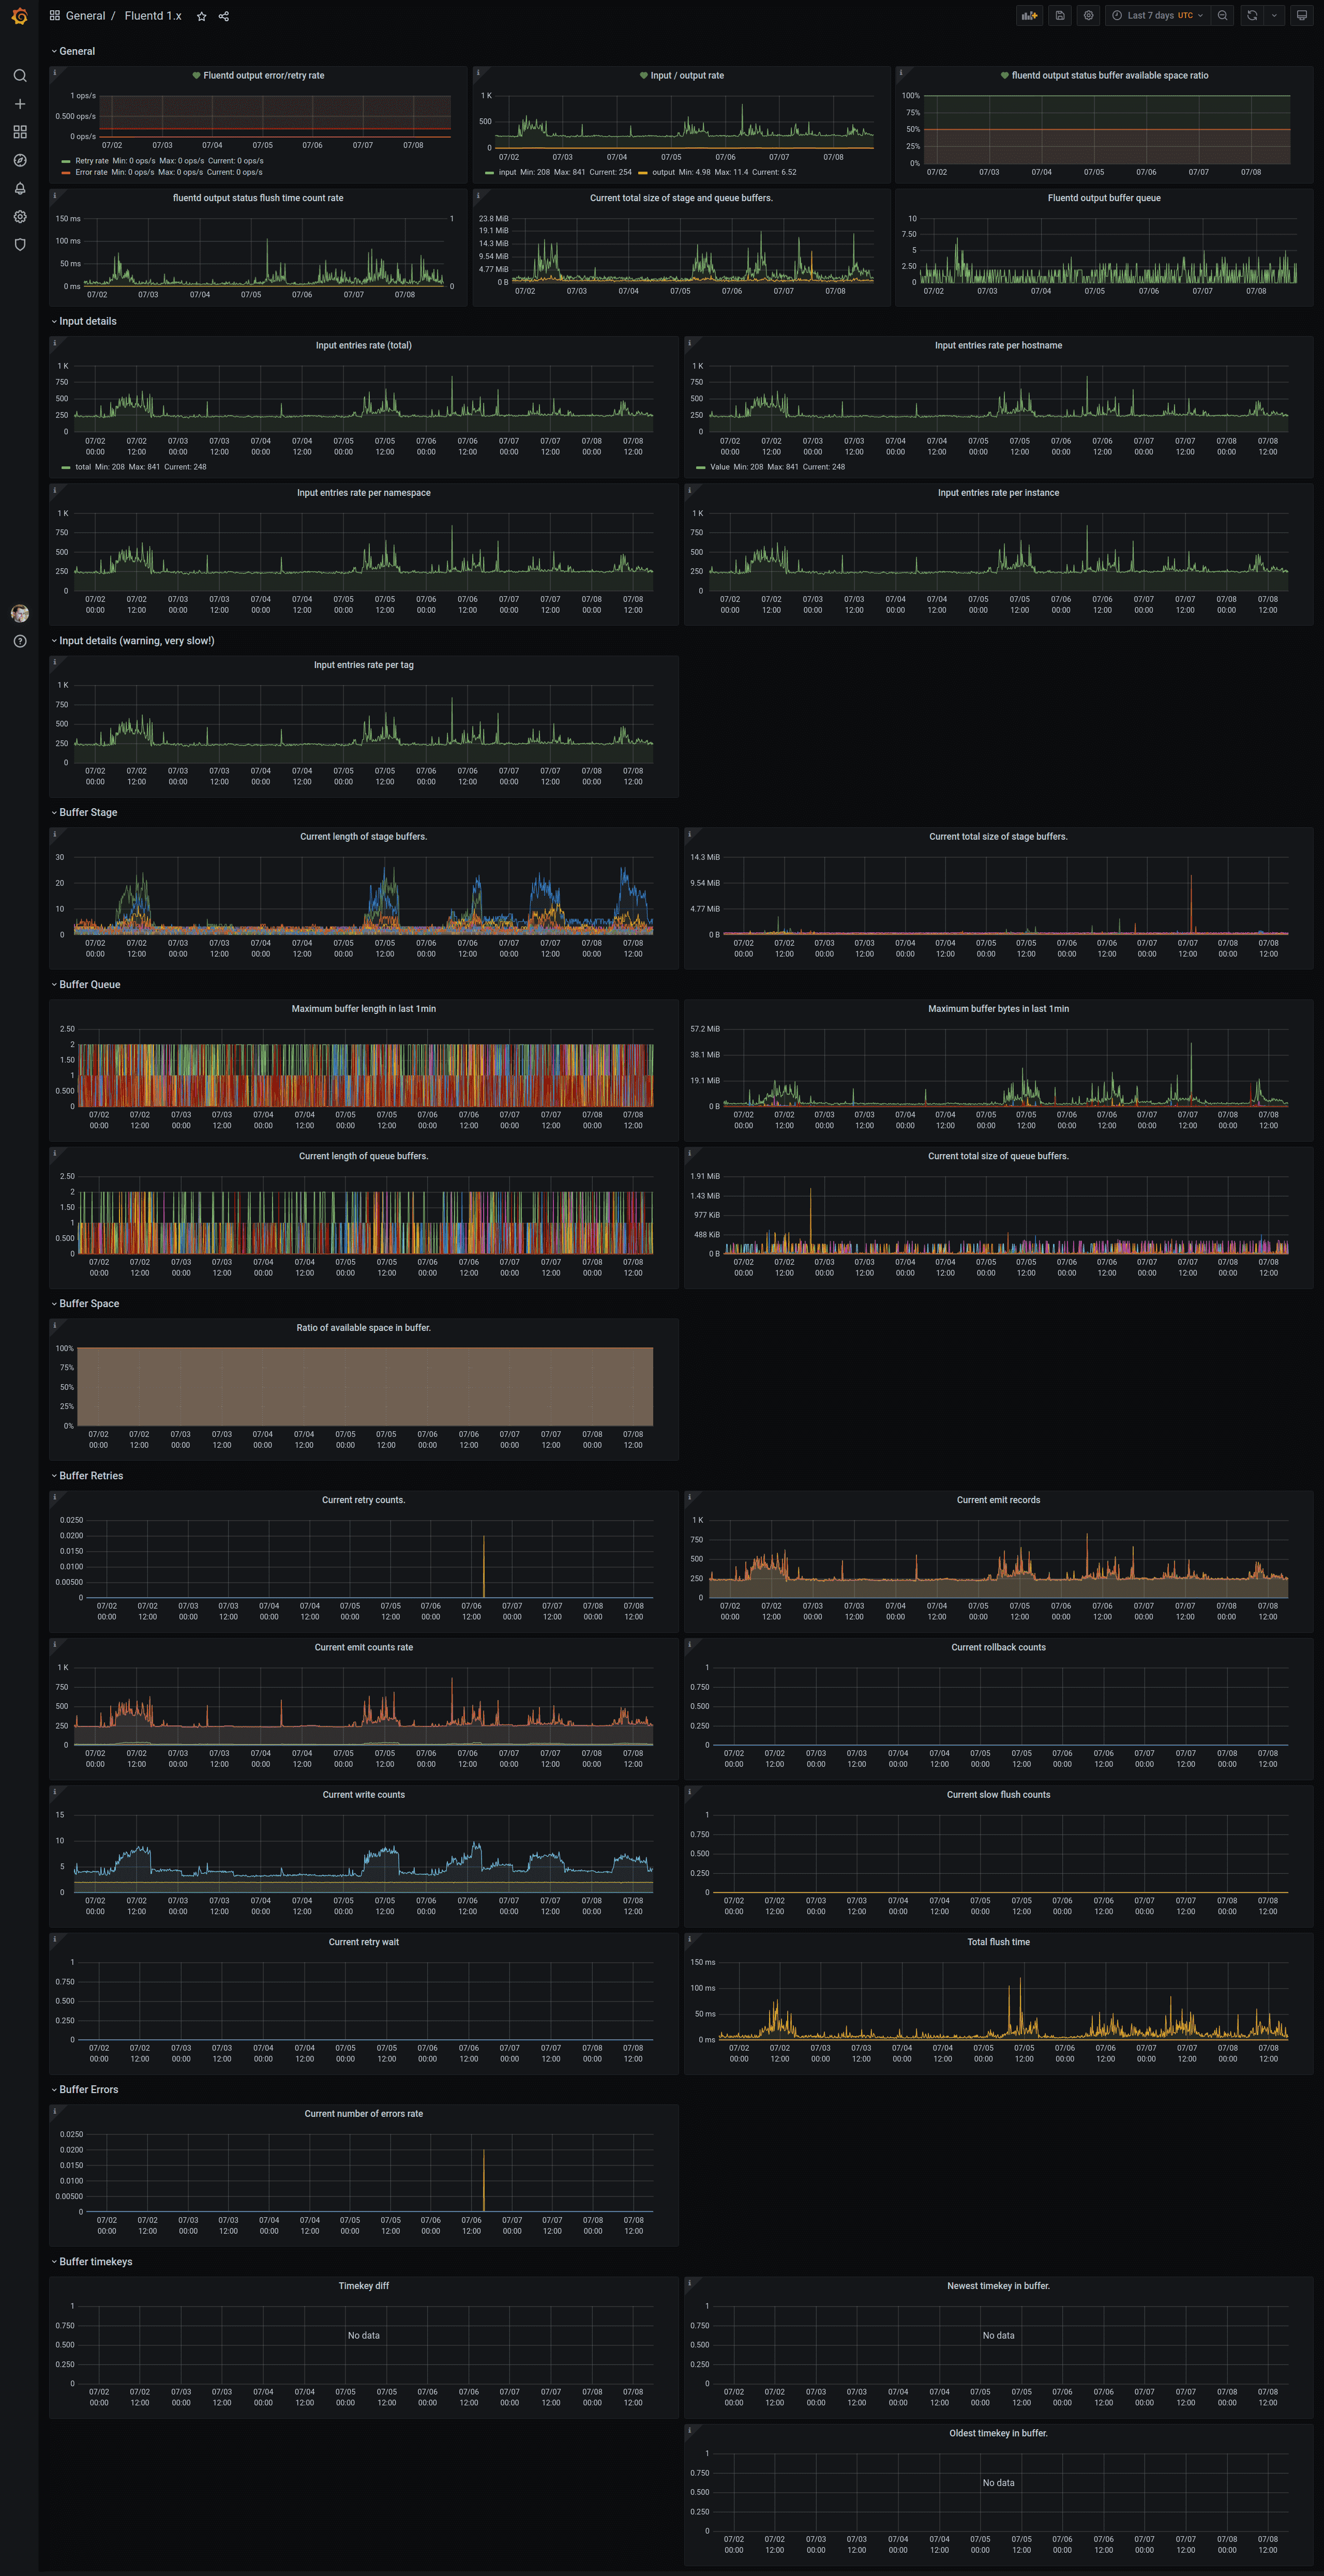
Fluentd 1.x
fluentd 1.x deployed in kubernetes and scraped by prometheus
About
Fluentd 1.x deployed in k8s and scraped by prometheus.
Known limitations
- Input filter by tag can produce insane amount of labels for metric, especially when using fluent-plugin-kubernetes_metadata_filter. This can severely influence prometheus performance (and also grafana), that's why it's safer to use tag_parts[0] or tag_prefix[x].
- There is no direct info about number of instances of fluentd or their cpu usage, you can add it on your own
Tested with:
- fluentd 1.11 (it may work with older images but not tested)
- kubernetes 1.14 and up
- prometheus 2.17.x deployed via prometheus-operator
- grafana 6.7.x, (notice this was not tested with grafana 7.x)
This should be compatible with most of installations that support prometheus metrics in fluentd - this depends how it is deployed, for example some helm charts have special param to enable it in helm chart values, otherwise you may need to use custom container with prometheus metrics plugin installed and added configs to expose metrics.
Works with most common helm charts and prometheus-operator:
- helm chart
stable/fluentd(in values.yaml setmetrics.enabled: trueandmetrics.serviceMonitor.enabled: true) - helm chart
kiwigrid/fluentd-elasticsearch( in values.yaml setserviceMonitor.enabled: true) orkokuwa/fluentd-elasticsearch - helm chart
fluent/fluentdafter major changes ;)
To enable input stats, you may need to add config section to any file:
<filter **>
@type prometheus
@id filter_prometheus
@log_level warn
<metric>
name fluentd_input_status_num_records_total
type counter
desc The total number of incoming records
<labels>
tag ${tag_parts[0]}
hostname ${hostname}
</labels>
</metric>
</filter>
References
- fluend monitoring
- fluent-plugin-prometheus
- kiwigrid/fluentd-elasticsearch helm chart fluentd-elasticsearch
- kokuwa/fluentd-elasticsearch helm chart fluentd-elasticsearch
- stable/fluentd helm chart
- fluent/fluentd helm chart
Contact
- contact author if you have any suggestions etc
Data source config
Collector config:
Upload an updated version of an exported dashboard.json file from Grafana
| Revision | Description | Created | |
|---|---|---|---|
| Download |


